
Figure 9.1Expectations turn into decisions about mechanisms, materials and interactions.
Part III — Building Digital Products · Chapter 09
How to turn a population’s expectations into engineering decisions, experiment with rigor and use evidence to improve physical products, digital products and services.
There is a part of engineering that especially interests me: the ingenuity we need to solve a need with the materials, capabilities and constraints we have around us. It becomes visible when a chair adapts to the body, a bank benefit makes sense or an app lets someone finish a task without asking for help. In all those cases, technical decisions end up as part of what a person feels when using the product.
Throughout my career I have found an ever closer relationship between that capacity to solve and quality. We can have good suppliers, specialists and platforms, but we still need to know what we expect to achieve and for whom. A specification can be met impeccably and deliver something the customer does not need. We can also identify a real need and build a solution unable to serve it consistently.
That is why I believe engineering excellence begins in the definition of the product. That is where we decide whom to listen to, what to measure, how much risk to accept and what evidence will let us say that something works. Statistics helps sustain those decisions, as long as we remember that behind a mean, a distribution or an abandonment rate there are people whose conditions of use can be very different.

My way of understanding quality starts from meeting the customer’s expectation within a given population. That idea has clear antecedents. Joseph M. Juran related it to fitness for use; Philip B. Crosby, to conformance to requirements. W. Edwards Deming insisted on understanding the system and its variation in order to improve in a sustained way. These are not identical definitions, but together they connect the need, the specification and the consistency of what we deliver.1, 2
For a long time I explained my concept by talking about the customer’s expectation at a population mean. The expression needs a refinement: a population does not have a single expectation, and its mean does not necessarily represent a real person. What we are after is knowing the distribution of needs among those we want to serve, making commitments and checking to what extent we keep them. My definition is a personal synthesis of those ideas, not a literal quotation attributable to any of those authors.
It also helps to separate population, sample and sample space. The population is the set we want to learn about: for example, the holders of a card who meet certain conditions during a period. The sample is the subset we observe. In probability, the sample space is the set of possible outcomes of an experiment; it is not the technical name for the people interviewed. In customer research we also need a sampling frame: the list or mechanism from which we can select participants.
With that refinement, I would say quality means consistently meeting the relevant expectations and requirements of a defined population, with enough evidence to know both the compliance and its limits. This includes conditions the customer may not know how to articulate, such as the safety of a mechanism, the integrity of their data or the accessibility of a feature. Users do not have to know the specification of a screw to expect the chair to be safe.
If it works some of the time and not the rest, we will have a promise that depends on luck.
The practical consequence is important. If the product meets a poorly researched expectation, we will have conformance to the wrong specification. If it works only for those who resemble the team that built it, we will have limited coverage. And if it works some of the time and not the rest, we will have a promise that depends on luck. All three situations call for product decisions, even when they show up as engineering problems.

Consider an illustrative example, unrelated to the results of my projects. Five users take 2, 3, 3, 4 and 18 minutes to complete a redemption. The mean is 6 minutes: we add the times and divide by five. The median is 3: we sort the values and take the middle one. Both figures are correct, but they answer different questions.
The mean helps size the total time consumed and can serve to estimate operational capacity. The median better describes the center of this distribution, because the 18-minute case shifts the average considerably. Still, choosing the median because it produces a nicer result would be another way of hiding the problem. That user is also part of the experience we deliver.
To decide, we need to look at the dispersion, the conditions of the extreme case and, when volume allows, percentiles. A 95th percentile of time indicates the value that approximately 95% of observations do not exceed, depending on the calculation method used. It does not promise that everyone will finish before that limit. In an app it can help reveal waits the median conceals; in a service, it can help us understand how many customers face particularly long delays.
The same logic appears when designing a chair. An average height does not simultaneously solve the needs of someone with short legs and someone with long legs. Nor will a person at the 50th percentile of stature necessarily be at the same percentile of forearm length or hip width. That is why anthropometric design requires relevant dimensions and real combinations, along with adjustment mechanisms.
Before choosing an indicator, it is worth recognizing which decision will depend on it. The average can guide a cost estimate; the median can describe a central experience; the extremes can reveal exclusions or risks. And a satisfaction scale needs additional care: going from two to three stars does not have to represent the same subjective change as going from four to five. No summary replaces reading the distribution and the responses that produced it.
Figure 9.4

When I worked for a bank we took part in defining a loyalty program with Payback points. There was a reasonable commercial intention: to offer something in exchange for using the card and to maintain a relationship with the customer. There were partnerships and rewards, but we found a gap between the interest that receiving a benefit aroused and the actual use of what we offered.
Our impression was that almost no one understood how the program worked. People were interested in getting something for their purchases, but few took up the partnerships we had available. That observation was not yet an explanation. We could be facing a communication problem, a problem with the relevance of the reward, with the effort required to redeem or with conditions that were hard to meet. Each possibility would have called for a different intervention.
We began by determining the population we wanted to understand and selecting a sample. Then came the interviews, the surveys, reading the responses, classifying them and analyzing the results. The loyalty plan’s strategy was built on that information, and we later established control groups within the selected population to measure performance. I do not have a verifiable improvement figure here, so there would be no point in turning that memory into a success percentage.
Having a benefit available is not the same as delivering an experience of value.
What I can recover is the lesson: having a benefit available is not the same as delivering an experience of value. Between the two lies a sequence the customer must be able to travel. They need to find out about it, understand the conditions, identify a reward that matters to them, meet the requirements and receive what was promised. Each transition has design, operations and engineering components.
If I had to represent that journey today, I would distinguish exposure to the program, comprehension, eligibility, redemption attempt and receipt of the benefit. These are categories proposed to analyze the case, not a reconstruction of the exact measurements we made. They would help us avoid a hasty conclusion: that low redemption necessarily means lack of interest. It can also indicate that the interest exists and the product cannot turn it into a possible action.
Figure 9.6

Defining a population forces uncomfortable decisions. If we listen only to those who already redeem, we will learn a great deal about users who overcame the barriers and little about those left out. If we invite only from within the app, we will stop observing those who never open it. And if we depend on voluntary responses, the most satisfied or the most annoyed people may well participate more often.
In a program like this it could be useful to distinguish customers who know about the benefit and use it, those who know about it but do not use it, and those who do not know about it. Tenure, frequency of use, location or usual channel could also matter. These categories must respond to a product hypothesis, not to how easy it is to fill a presentation with segments. Having more groups does not guarantee understanding people better.
Interviews and surveys provide different evidence. An interview can uncover a difficulty we had not considered; a well-designed survey can help us estimate how often it occurs. To go from open responses to data we need classification criteria, we need to keep the original text and we need to review ambiguous cases. A single response can contain several causes, and forcing it into one box can distort what the customer said.
We also have to resist the temptation to present every sample as representative. The size required depends on the precision sought, the variability, the selection design and the comparison we want to make. For an experiment, what matters, among other things, is the minimum effect we need to detect. A large sample obtained from a biased channel can describe the wrong population with great precision.
In small exploratory work we can find valuable problems without estimating their prevalence in the market. That was relevant in my experience with furniture: the budget limited the number of participants, but their observations could change concrete decisions. The limit lay in what we could claim afterward. Finding a difficulty in several people justifies investigating it; it does not automatically show what percentage of all buyers will experience it.

When I think about that bank program, I recognize a continuity with practices other industries developed much earlier. Procter & Gamble places the beginning of its formal consumer research in 1924, with the collection of information and differentiation by household characteristics. It is a useful antecedent because it shows that observing the buyer, classifying responses and carrying them over to the product did not begin with digital analytics.3
Industrial history has another, complementary line. In May 1924, Walter A. Shewhart presented the outline of a control chart; his later work helped distinguish a process’s usual variation from signals that called for investigation. NIST also records the contributions of Harold Dodge and Harry Romig to acceptance sampling. Here the question was how to produce consistently and how to evaluate lots without depending exclusively on checking every finished piece.4
In parallel, Ronald Fisher worked at Rothamsted from 1919 and contributed to the development of experimental design from agricultural problems. Comparing treatments required considering that two plots could differ for reasons unrelated to the fertilizer. That need to separate the effect we are looking for from the conditions around it is still recognizable when we compare two digital experiences.5
Clinical research contributed another decisive tradition. The Medical Research Council trial of streptomycin and tuberculosis, published in 1948, is a milestone for its design and for the measures taken to avoid knowing treatment assignment in advance. It was not the first use of comparison, nor can it alone sum up the birth of experimentation. Nor would it be accurate to say that pharmaceutical companies invented these methods and then transferred them to every other industry.6
The continuity reaches companies such as Nestlé, which describes the use of sensory research and consumer feedback to improve products, and Unilever, which evaluates dimensions such as product, packaging, proposition and price. They are different applications of a shared discipline: observe, compare and adjust.7 In medicine, moreover, clinical efficacy and safety do not reduce to commercial satisfaction. We can learn from its methods without fully equating a patient with a buyer or turning a clinical trial into a sales funnel.

I had the opportunity to collaborate with colleagues dedicated to measuring anthropometry and studying its impact on the design of office chairs. The purpose included improving posture and reducing conditions that could harm the joints. Taking part in that project, I found a great deal of experimentation, recording and listening. The responses of those who tried the product were read in relation to the target market we sought to serve.
The budget forced us to work with a small sample. Even so, the information had important consequences for the engineering: it helped define the construction, the leveling systems and the posture adjustments. We then had to find suppliers able to respond to the design and its technical specifications. The research did not end in a recommendation; it continued all the way to the conditions needed to manufacture.
To explain the kind of relationship that appears in those projects, imagine that one person cannot rest their feet properly, another feels pressure behind the knees and a third cannot comfortably reach the adjustment. These are illustrative examples, not observations I am attributing to that project’s records. Each one leads to reviewing different variables: height, depth, geometry or location of the mechanism. The phrase “it isn’t comfortable” has to become questions we can investigate.
In addition, perceived comfort, observed posture and injury prevention are different outcomes. A short test can help us understand the first two; demonstrating a reduction in injuries requires a different scope, follow-up and evidence. Honesty about that limit is part of quality. We cannot turn a favorable comment into a clinical claim about protecting the joints.
What interests me most about that experience is how the user’s voice reached a material decision. Changing an adjustment range could require another mechanism, alter the cost, reduce the number of available suppliers or change maintenance. The engineering of the surroundings thus entered the product’s promise. Designing an excellent adjustment that we cannot manufacture consistently still leaves the need unresolved.
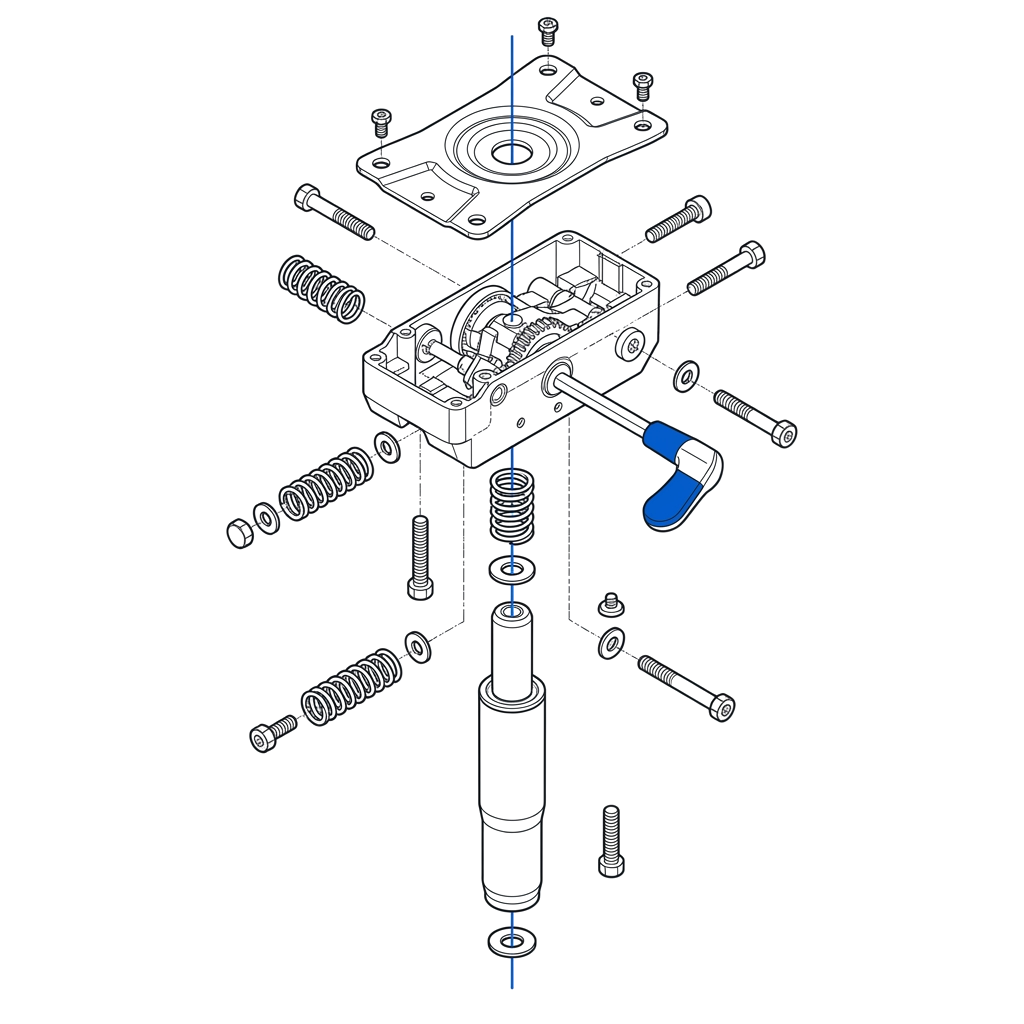

If we wanted to evaluate a new chair mechanism, we could compare a group using the reference model with another trying the modification. We would have to define beforehand what we will measure, under what conditions and for how long. The task, the duration of use and the characteristics of the participants could influence the result as much as the mechanism. A useful comparison has to recognize those factors.
When feasible, random assignment reduces the risk that the groups differ systematically from the start. Another option is for one person to try both versions, alternating the order among participants. That design can be useful for certain measures of use, but it must account for learning, fatigue and effects that persist from one test to the next. Not every product admits the same experiment.
In the loyalty program, a control group lets us estimate what would have happened without the intervention. Suppose, purely as an example, that a new explanation reaches 12% redemption and the control reaches 9%. The difference is three percentage points, equivalent to a relative increase of approximately 33.3%. That arithmetic does not by itself demonstrate an effect: we still need to review the size of the groups, the uncertainty, the assignment and the observation period.
It is best to fix the primary metric and the decision conditions before looking at results. If we search through enough indicators, it will always be easier to find one that seems to improve by chance. We must also watch the experimental unit: assigning by user avoids certain crossovers between sessions, but it may be necessary to assign by household or branch when people share information and contaminate the comparison.
Nor is a control group the same as a control chart. The first serves to compare an intervention; the second helps monitor a process over time. And a randomized experiment on a biased sample may estimate the effect within that sample well without justifying a conclusion for the whole market. The quality of the comparison and the possibility of generalizing are related but distinct questions.

In digital product I find an affinity with that discipline when we talk about Test-Driven Development, or TDD. Its cycle consists of writing an automated test that fails, implementing the code needed to make it pass and then improving the structure of the code while keeping the tests passing. It is a development practice that forces behaviors to be made explicit and provides quick feedback on them.8
The comparison with physical work is useful if we respect its limits. A code test can verify that an insufficient balance prevents a redemption or that a retry does not duplicate an operation. It cannot by itself show that the customer understands the points, values the benefit or finds the journey accessible. TDD lets us check part of the solution we built; researching the user lets us question whether that solution answers the need.
That is why I would not describe TDD, A/B testing, soft launch and friends and family as interchangeable names. An A/B test compares variants through an experimental design; a limited launch restricts initial exposure; a test with people close to us makes early observations easier, though it introduces selection and familiarity bias. We can combine these practices, but each produces different evidence.
Table 9.1 — What each practice lets us learn
| Practice | What it lets us learn | Main limit |
|---|---|---|
| TDD | Whether the code meets the behaviors expressed in tests. | Does not by itself validate the need or satisfaction. |
| Usability test | How a person understands and performs a task. | A qualitative finding does not automatically estimate its frequency in the population. |
| A/B with proper assignment | The effect of one variant against another under the conditions studied. | Needs appropriate sample, duration and metrics. |
| Limited launch | How a release works with bounded exposure. | Limiting reach does not create an experimental control. |
| Friends and family | Early problems observable with close participants. | Closeness can favor tolerance, prior knowledge and agreeable answers. |
The valuable link is that observations of use can feed requirements and tests. If we learn that the customer fears losing points when the connection drops, the team can design recovery, confirmations and consistency guarantees. Then the technical behavior has to be verified and the experience observed again. A completely green test suite does not close that conversation; it lets us continue it on a more reliable basis.
Figure 9.13

The history of medical research shows that having resources and technical rigor does not eliminate selection bias. In the United States, a 1977 FDA guideline recommended excluding women of childbearing potential from phase I and the early stages of phase II, out of concern over reproductive and fetal development risks. The restriction was withdrawn in 1993. In 2026 we are talking about a policy that originated 49 years ago and was revised 33 years ago, not simply that “forty years ago they only tested on men.”9
The difference matters: not all women were excluded from all trials and all phases. The problem included insufficient representation and lost opportunities to learn about differences in response from early stages. In 1993, in addition, the NIH Revitalization Act incorporated requirements for including women and minorities in NIH-funded clinical research, with defined conditions and exceptions. Its scope should not be confused with that of all research conducted in any country.10
We must also be careful in interpreting warnings about pregnancy. Some reflect a lack of sufficient data; others respond to risks identified through human, animal or pharmacological evidence. It is not correct to assume a warning exists only because the medication was not tested in pregnant women. The FDA sets out labeling that distinguishes a risk summary, clinical considerations and available data precisely because those situations are not equivalent.11
The lesson for digital product is to recognize whom our observation mechanism excludes. We can test on recent phones, stable networks and tech-savvy participants, and then present the result as a universal property. We can listen only to active customers and leave out those who dropped off during sign-up. We can even mistake an absence of complaints for satisfaction when the channel for complaining is inaccessible.
Labeling people is not the same as understanding them.
The problem also reaches categories. Sex, gender, age, disability and ethnic background are neither interchangeable variables nor automatic explanations. In a study we have to justify what information we need, how it is obtained and what hypothesis it lets us evaluate. Labeling people is not the same as understanding them. A segmentation can reveal a barrier, but it can also entrench prejudice if we read the label as the cause.

Today we can look at heat maps, buttons used, features adopted and dashboards consulted. That capacity is valuable, though it creates a temptation: to measure what the tool delivers easily and then look for a meaning. A much-pressed button may be useful, confusing or unable to respond on the first try. A little-visited page may be irrelevant or may solve a rare need of enormous importance.
To evaluate quality I prefer to connect signals with a task and its outcome. In a redemption process I would distinguish viewing the benefit, starting the request, completing it in the system and actually receiving the reward. The click lives in the interface; fulfillment may depend on an external service and a later operation. If we observe only the first, we can celebrate an improvement the customer never received.
Measurement engineering requires agreeing on event names, identifiers, timestamps and rules for avoiding duplicates. It also needs to distinguish intent from confirmation. An event emitted on pressing “redeem” should not be called “redemption completed” if the system’s response is still pending. Instrumentation failures can produce conclusions as wrong as product failures.
Something similar happens in an enterprise tool. That a dashboard is the most viewed does not show it improves a decision. We can explore whether it reduces the time needed to resolve a task, whether its data are reliable and whether it avoids later work. In a service, a shorter interaction could indicate efficiency or a conversation cut off before the problem was solved. Measurement needs to follow the customer through to a meaningful outcome.
Finally, an association between actions is not enough to establish causality. The most engaged customers might use a feature more and renew more, without the feature alone explaining the renewal. That finding justifies a hypothesis and perhaps an experiment. Skipping that step turns a promising correlation into an investment priority we have not yet demonstrated.

In discussions about customer data, CRM, CDP, product analytics and revenue management tend to get mixed up. It is worth sorting out their roles, because a platform does not automatically solve the work of the others. Here I use RGM in the usual sense of Revenue Growth Management: a discipline for managing growth through price, promotions, mix and presentation of the offer, which can draw on different technological solutions.12
A CRM organizes the commercial and service relationship. HubSpot brings together capabilities for managing contacts, opportunities, marketing and support; its usefulness for product lies in relating commercial promises, friction and continuity of the relationship. Treasure Data is a CDP geared to integrating data and building profiles and segments. Mixpanel works with events to analyze journeys, conversions and retention. The capabilities available depend on the configuration and contract of each product.13, 14, 15
Table 9.2 — Platforms and capabilities with different jobs
| Capability or platform | Data it can gather or analyze | Possible indicators | Application to improvement |
|---|---|---|---|
| RGM | Prices, units, discounts, channels and product mix. | Margin, revenue per unit, response to promotions and estimated elasticity. | Review whether the offer is attractive and economically sustainable. |
| CRM / HubSpot | Contacts, opportunities, interactions, tickets and configured surveys. | Commercial conversion, support times, recurrence of problems and reported satisfaction. | Connect purchase expectations with later difficulties. |
| CDP / Treasure Data | Profiles and integrated information from channels and transactions. | Identity coverage, activity and conversion by segment, depending on available data. | Unify observations and activate relevant experiences for each group. |
| Analytics / Mixpanel | Instrumented events, properties, users and sequences. | Conversion by stage, retention, frequency and feature adoption. | Locate friction and follow how behavior evolves. |
These indicators do not necessarily appear ready to use, nor do they have a universal definition. Retention depends on the event we consider valuable and the interval chosen. Margin requires reliable costs; elasticity demands an analysis that separates out other changes; the satisfaction of those who respond may differ from that of those who stay silent. Buying the platform does not replace that work.
Applied to the loyalty example, the CRM could show repeated inquiries about points; the CDP could help link those inquiries with profiles and transactions; analytics could locate a drop before redemption; and RGM could evaluate the cost of changing the benefit. Together they can support an investigation. None by itself authorizes concluding what caused the drop, and we do not always need to deploy them all to make a useful first decision.
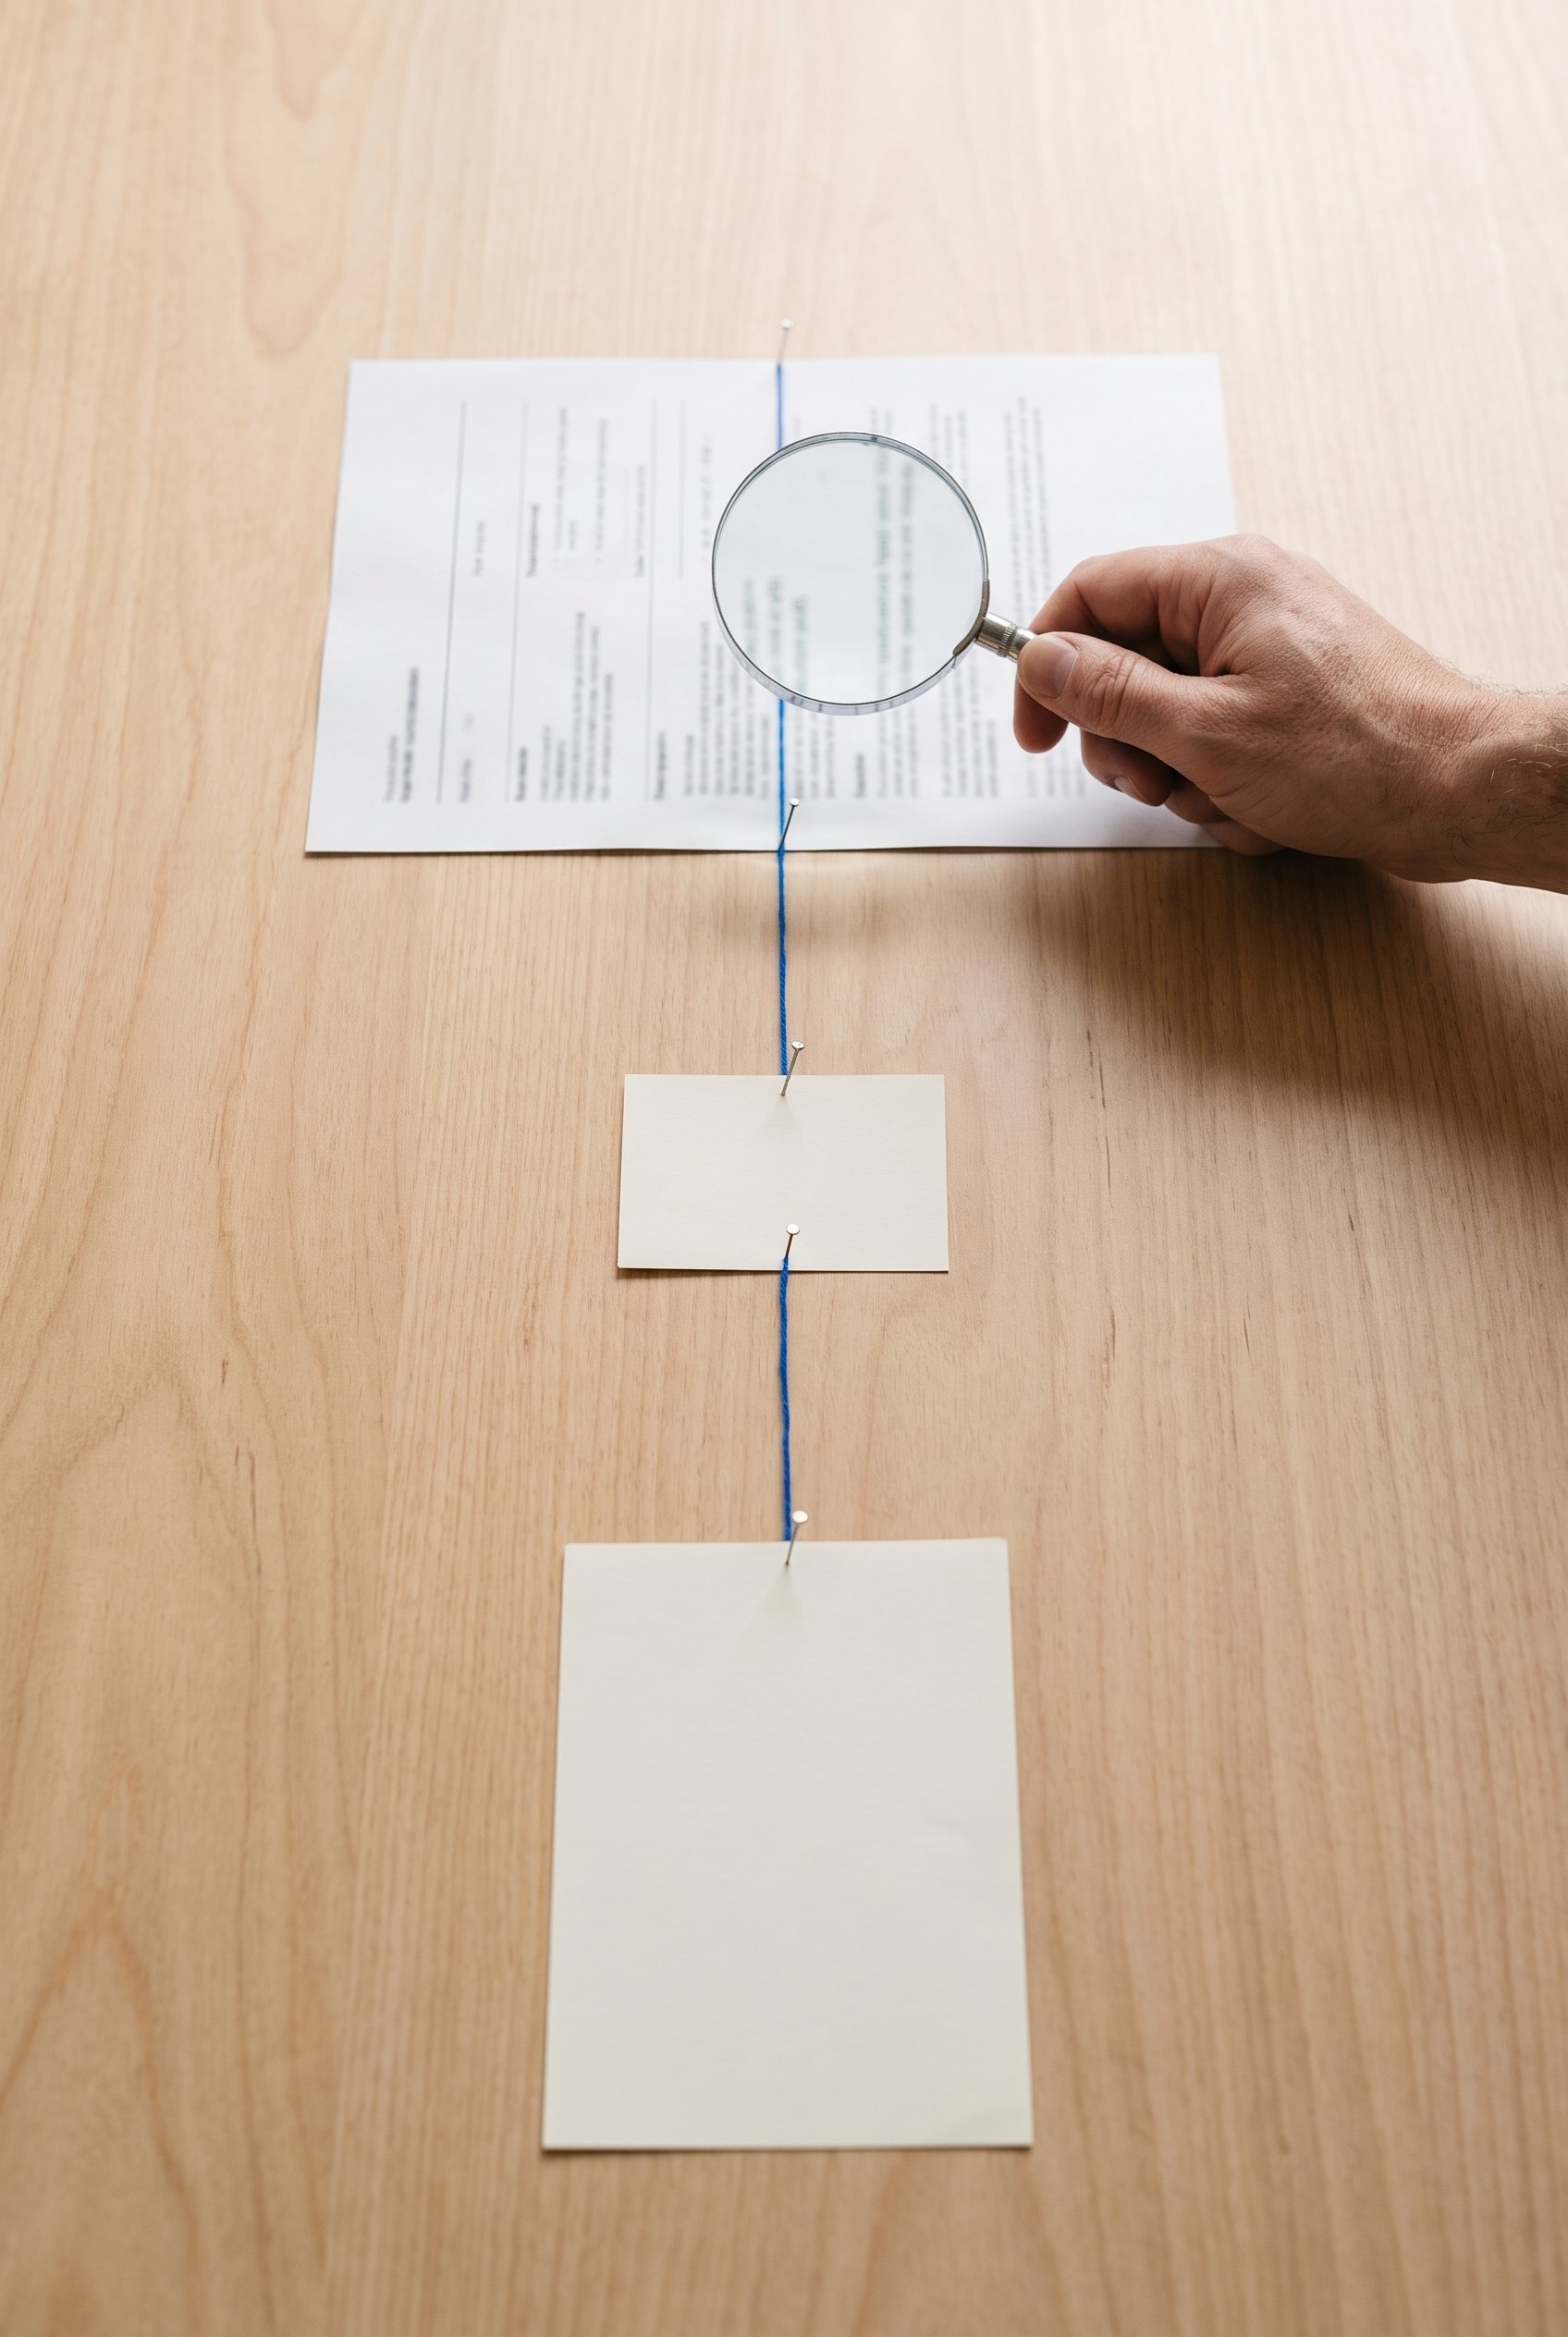
Artificial intelligence can help classify open responses, propose interview themes, summarize incidents or explore behavioral groupings. In research with hundreds of comments, a reasonable application would be to use it to suggest categories and then review a sample of the classifications against the original texts. That way we can take advantage of speed without losing the ability to check what happened to each response.
The risk appears when we mistake fluency for fidelity. A summary can erase contradictions, a classification can fail more often with certain vocabulary and a segment can mainly reflect the variables we decided to capture. If a population did not take part in the study, generating synthetic responses with AI does not add it to the evidence. It can serve to explore hypotheses, but it does not replace observing those people.
That is why I would preserve traceability between response, category and conclusion; I would review errors by group and document changes in the model or in the classification instructions. I would also limit personal data to what the question needs. The ability to join sources does not justify doing so indiscriminately. Research should allow learning without turning every user interaction into information available for any purpose.
The most interesting opportunity lies in shortening the path between observation and decision. A detected pattern can become a hypothesis, that hypothesis an experiment and its result a change. Continuous improvement happens when we complete that path and measure again. Classifying more information without changing anything produces tidier archives, but not necessarily a better product.

All of the above ends in concrete engineering choices. In the chair, the evidence may demand a mechanism with a different range, different tolerances or a supplier able to hold a specification. In the loyalty program it may lead to changing rules, simplifying explanations, confirming transactions or reviewing the integration with whoever delivers the benefit. In both cases we are deciding how to build a promise that can be kept.
The environment matters because we do not design in a vacuum. We have certain skills, processes, budgets and dependencies. A solution the team cannot operate introduces fragility; a supplier without restocking capacity compromises maintenance; an integration without reliable confirmations makes it hard to know whether the customer received what was theirs. These conditions need to be present from the definition of the product and in the planning of the project.
I would organize that work in four moves: defining the population and the expectation; translating them into observable requirements; comparing alternatives with an appropriate method; and reviewing the result during operation. The product lead holds the relationship between need and decision, specialists design and verify the solution, and project management ensures that research, testing and corrections have time and resources. If we budget only for construction, we are assuming we already know everything we need to.
Define, translate, compare and review: from understanding to a promise that can be kept.
01
The population and the expectation.
02
Into observable requirements.
03
Alternatives with an appropriate method.
04
The result during operation.
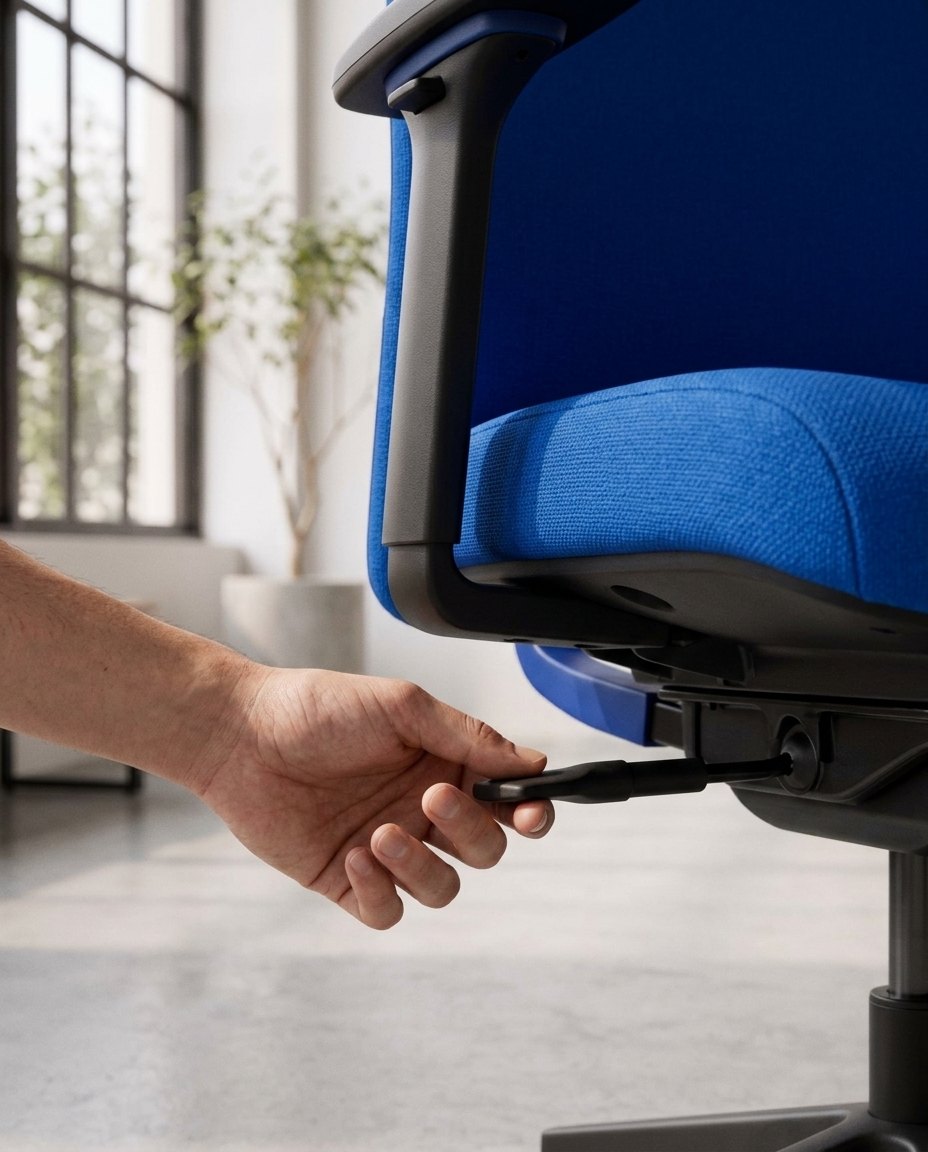
The decision to expand a release should consider the improvement sought and the limits we refuse to let deteriorate. More frequent redemption may be valuable, but we have to review failures, complaints, costs and delivery capacity. A chair can improve its adjustment and become harder to repair. Quality calls for a joint reading because the customer receives the whole product, not the metric each area chose to show its progress.
In the end I come back to what interests me about engineering: its capacity to turn understanding into a solution that works. Listening to a person, locating their experience within a population and recognizing the limits of our evidence changes what we build. Excellence appears when those decisions let us consistently keep what we promised and go on learning from those who use the product. When something is well made, you can feel it; our work is to understand what makes that possible and to make that experience repeat.
The experiences at the bank and on the chair project come from the author’s account. The times, percentages and experimental designs proposed are teaching examples, not historical results from those projects. External references were consulted on November 3, 2026. Figure 9.8 is an illustrative still life, not a reproduction of historical documents.