JASPart I · Understanding the Product — Chapter 2

PART I — UNDERSTANDING THE PRODUCT · CHAPTER 02

Product Strategy, Materials and the Cost of a Decision

Every product begins as a promise made before enough is known. This chapter is about what that promise costs to keep.

Published Sep 16, 202614 min readEdition 0.2Status: Published

A physical product may begin with a sketch: a surface, a structure, a proposed relationship with the human body. A digital product begins with a vision of change — a customer who should be able to do something faster, more safely, or with less effort than before. Neither begins with a roadmap. A roadmap is already an act of translation, arriving only after the organization has chosen a direction.

Before it can exist, the organization must define its Product Vision, choose a Product Strategy and decide how delivered value will be recognized. A North Star Metric gives that value a measurable direction, and only then can a sequence of product bets be organized over time. At this point the product still exists mostly as intent — the team may understand the problem without knowing the real cost of solving it.

This is where feasibility begins — not the narrow question of whether something can be built, but an examination of whether it can be produced, operated, maintained and adapted under conditions the organization and the market can sustain. A technically possible solution is not automatically a feasible product. The rest of this chapter asks what that difference actually costs.

4LENSES A PRODUCT
MUST PASS THROUGH
6COST FAMILIES
FROM BUILD TO RETIREMENT
80%TYPICAL MATERIAL YIELD
IN THE WORKED EXAMPLE

Direction precedes planning

VISIONSTRATEGYNORTH STARMETRICROADMAP

What a Product Strategy Actually Commits To

A regional streaming strategy chosen deliberately over global reach
Choosing a regional audience over global reach — a strategy is as much about what a product will not do.

A Product Vision states a direction of change. A Product Strategy decides how the organization will get there under real constraints — which customers it will serve first, which problems it will refuse to solve, and how it intends to win against alternatives. Vision points; strategy commits.

Consider a fictional streaming product called Northline. Its vision is to give families immediate access to relevant regional stories on any connected device. That vision alone says nothing about how Northline competes with services that already have larger catalogues and larger budgets.

Northline’s strategy narrows the vision into a bet: serve a specific regional audience through a curated, locally produced catalogue, rather than compete on the sheer volume of global content. It deliberately trades reach for relevance and a lower cost of content acquisition.

A strategy is therefore as much about what a product will not do as about what it will. Northline will not license international blockbusters, will not attempt every device profile in its first year, and will not chase every geography a global competitor already owns.

This is the strategy the rest of the chapter tests against reality — because a strategy that cannot be produced, operated and paid for is not yet a strategy. It is a preference.

The Customer Value Equation

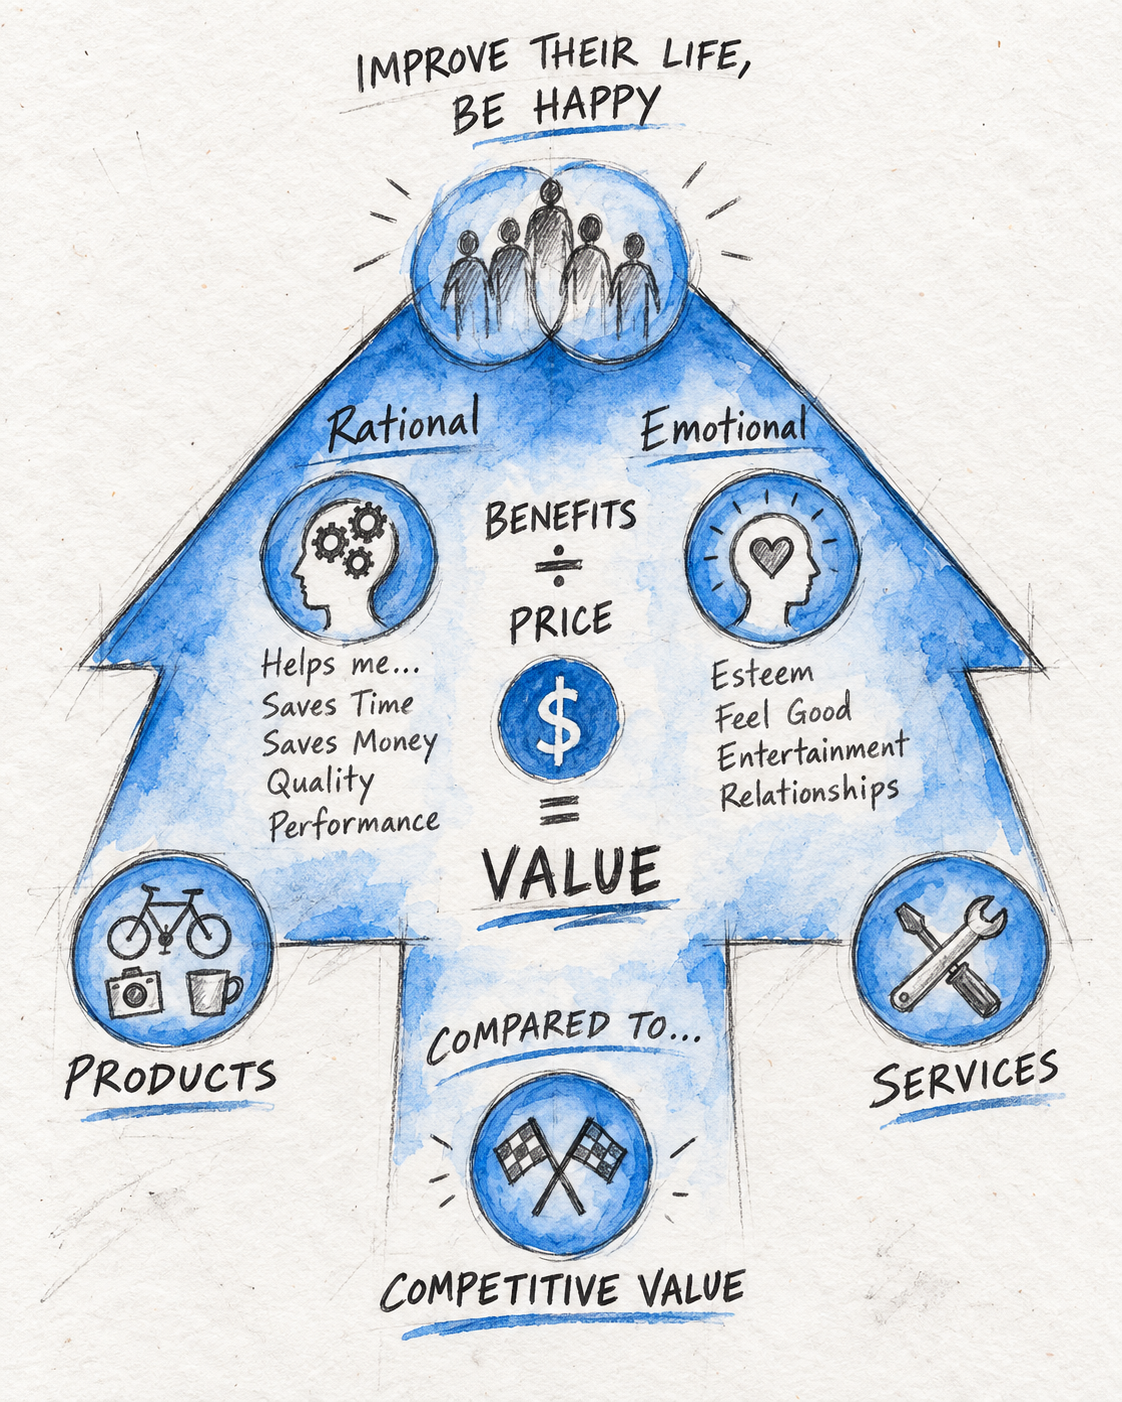
Benefits rising and price falling, widening the value a product delivers
Benefits up, price down, value grows — the same wedge that reshaped the smartphone market in 2007.

People buy a product because it improves their life or their business more than the alternatives available to them. That comparison is never made in isolation — it is always made against whatever else the customer could choose instead, including doing nothing.

A simple way to hold this in mind is a value equation: a product’s value equals its benefits, rational and emotional, relative to its price, judged against competitors. A product that improves this ratio faster than its competitors tends to keep the customers it has and attract new ones.

Value = (Rational Benefit + Emotional Benefit) ÷ Price — relative to the competitive set

For Northline, the rational benefit is straightforward: content a household cannot easily find on a larger, more generic platform. The emotional benefit is closer to identity — seeing a region’s own stories told on its own terms. Neither benefit matters if the price, in money or in friction, erases the advantage.

A product strategy therefore has two levers, not one: grow the benefits customers actually notice, or shrink the cost of delivering them. Improving both at once — better content, cheaper delivery — is what turns a narrow regional bet into a durable margin rather than a one-time novelty.

This is the same value wedge that reshaped the smartphone market in 2007, when a new entrant stopped competing on battery life and messaging speed and instead removed the unmet friction of using the internet from a phone at all. The lesson was never the device — it was where the value gap had been hiding.

The value wedge

GROW BENEFITSRational + emotionalSHRINK COSTPrice + frictionVALUE WEDGECUSTOMER KEEPSCHOOSING ITGROWTH

Which Dimensions Actually Compete

Choosing two competitive dimensions instead of trying to win on eight
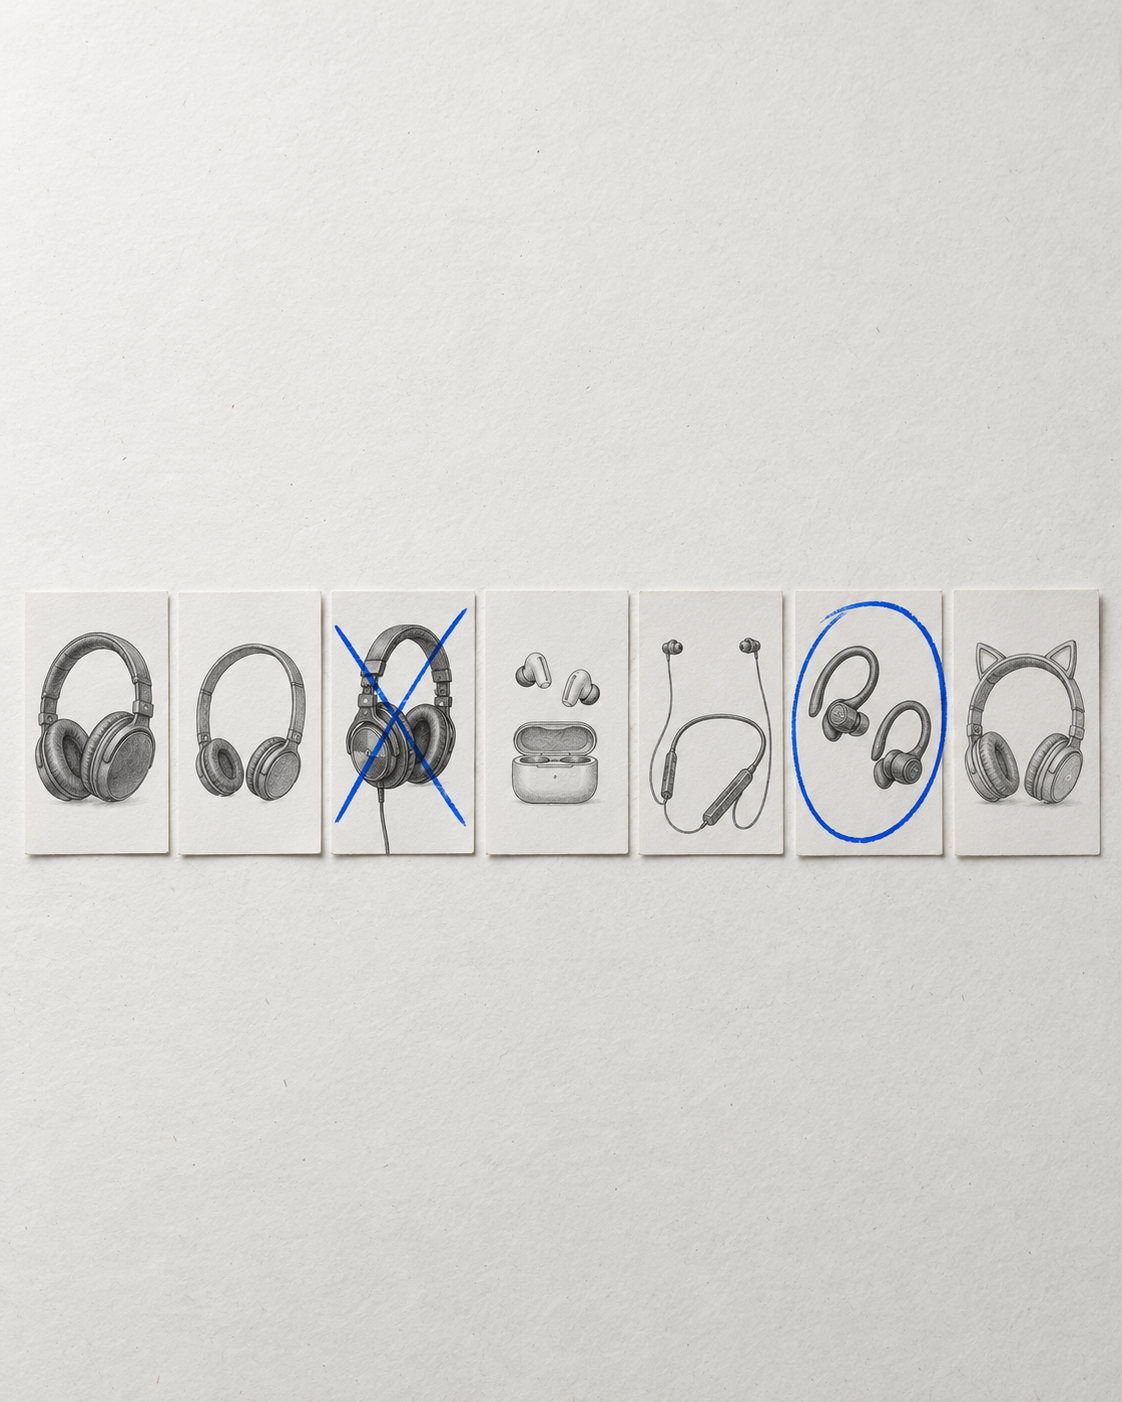
Picking two dimensions, not eight — tightening what customers barely notice is expensive over-specification.

Every product competes on a shortlist of dimensions: features, usability, performance, durability, reliability, serviceability, conformance and aesthetics. Not every dimension matters equally to every customer, and treating all eight as equally important is itself a strategic mistake.

A regional streaming product like Northline gains little by competing with a global catalogue on raw feature count. Its real contest is on usability — how fast a household finds something worth watching — and on reliability — whether the stream that starts on a Tuesday evening keeps playing.

Durability and serviceability, dimensions that matter enormously for a physical product, barely register for a streaming service; conformance to a regional content rating system, by contrast, may matter more to Northline’s audience than to a global competitor’s.

This is the same idea introduced earlier as tolerance, applied one level up: a strategy does not just set a tolerance for each dimension, it first decides which dimensions deserve a tolerance at all. Tightening a dimension customers barely notice is the strategic equivalent of over-specifying a bolt no one will ever inspect.

Deciding which two or three dimensions to compete on — and which the product can afford to be merely adequate at — is one of the clearest outputs a product strategy can produce.

Sources of competitive advantage

CUSTOMER VALUEBrand loyalty, innovation,network effectFINANCIAL VALUEScale, proprietarydata and informationLIMITED RESOURCEExclusive supply,licenses, IPCOMPETITIVE ADVANTAGE
Sustainable advantage tends to come from one of three kinds of barrier: what customers value, what the balance sheet can fund, or what a competitor simply cannot access.

Four Steps to a Product Roadmap

A roadmap is not a wish list in date order. It is the output of a disciplined narrowing, from insight to sequence.

  1. 1

    Generate Insights

    Product, market and customer signals.

  2. 2

    Develop Opportunities

    Use cases, features, a snapshot.

  3. 3

    Prioritize

    Value against effort, on one matrix.

  4. 4

    Build the Roadmap

    Sequence bets as a living document.

Two Outputs: the What and the How

A roadmap and a delivery plan laid out side by side
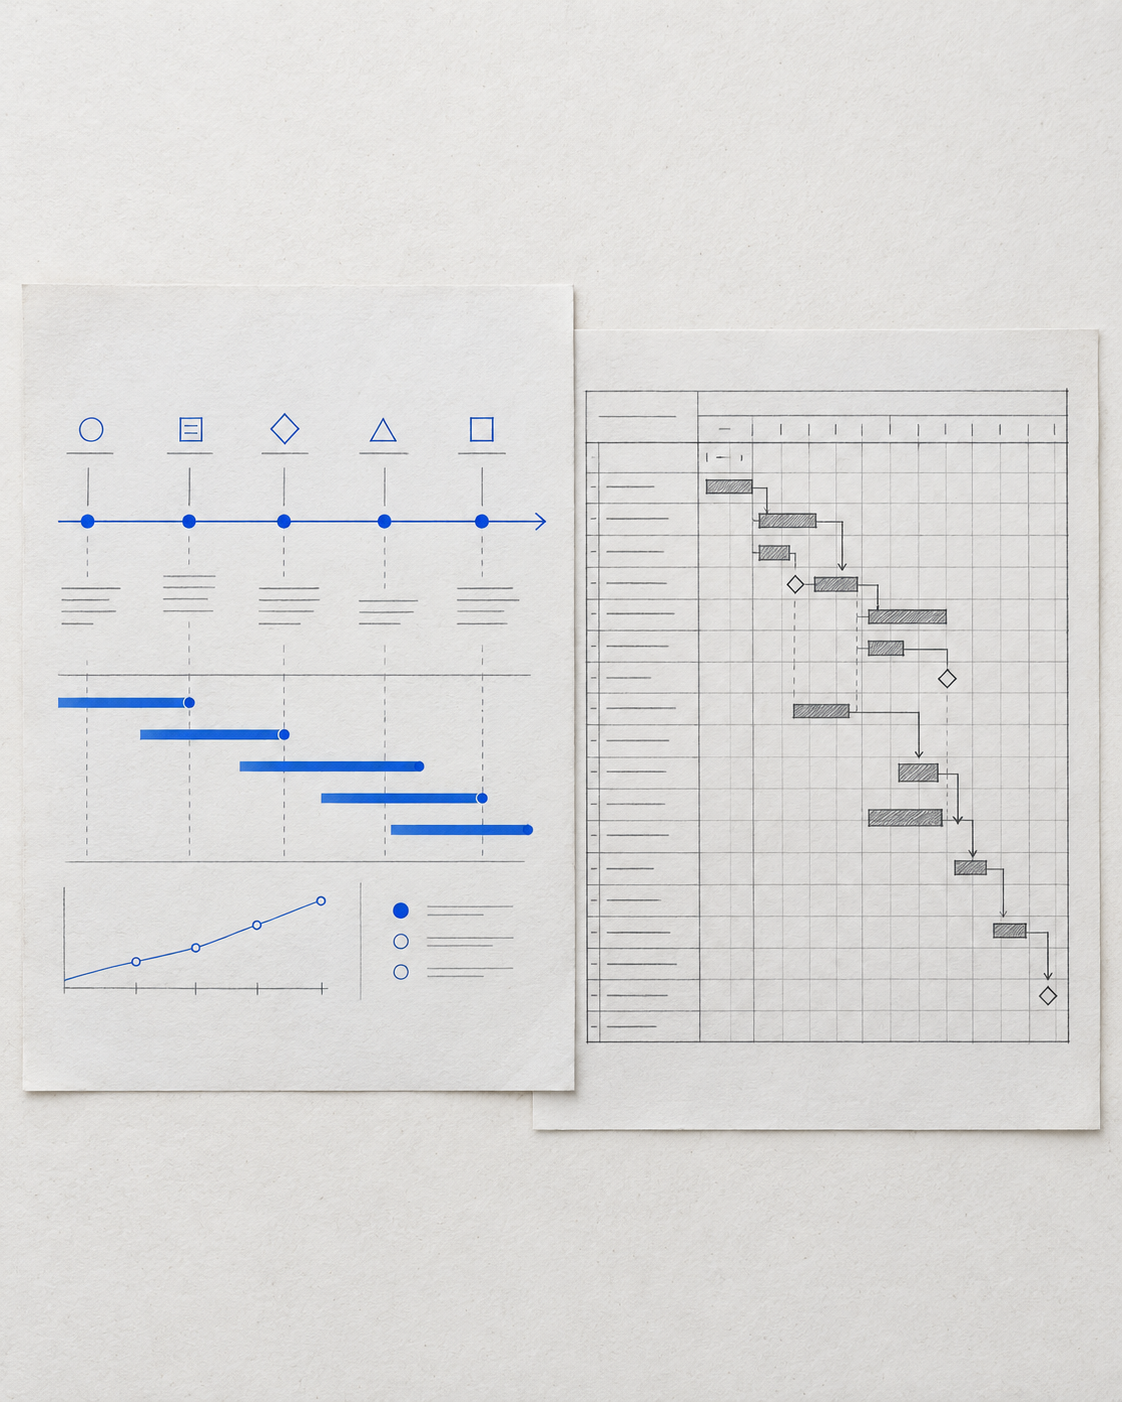
A roadmap and a delivery plan, side by side — negotiated together, not handed off.

A product strategy produces two distinct documents, and conflating them is a common source of confusion. The roadmap is the what — the sequence of product bets the organization has chosen to make. The product development lifecycle strategy is the how — the goals and initiatives that determine whether the organization can actually deliver that sequence.

The lifecycle strategy itself has three parts: effectiveness goals, which describe the outcomes the roadmap should produce; efficiency goals, which describe what it should cost in time and resources to produce them; and the initiatives needed to close the gap between current and target performance on both.

For Northline, an effectiveness goal already exists in this chapter: weekly hours of content successfully reproduced by active households. An efficiency goal exists too: the cost per successfully streamed hour. A roadmap without both is just a list of features; goals without a roadmap are just aspirations.

This is why a credible product strategy cannot be written by the product team alone, sealed, and handed to engineering and finance afterward. The roadmap and the lifecycle strategy have to be negotiated together, because a roadmap that ignores delivery cost is not a strategy — it is the upper-left quadrant from the decision quadrant below, unexamined.

Rationalize, Improve, or Build

A product portfolio deliberately edited, some capabilities kept, others retired
A portfolio, edited on purpose — rationalizing is the least comfortable of the three moves, and the most often skipped.

Every product portfolio decision reduces to one of three moves: improve what already exists, build something new, or rationalize — retire what no longer earns its cost.

An improvement should differentiate the product from competitors, drive better customer value, or open a new use case or segment. A new product should change the game, help sell more of the current lineup, or fill a real hole in the portfolio, not a hypothetical one.

Rationalization is the least comfortable of the three, and the most often skipped. Retiring a low-value feature or an underused content tier frees the budget and attention a genuinely new bet requires — the same sunk-cost trap the decision quadrant below was built to expose.

For Northline, this might mean retiring a device profile with negligible usage, improving discovery for its core regional catalogue rather than chasing catalogue size, and building exactly one new capability — localized recommendations — that a global competitor has no strategic reason to build first.

A Product Must Survive Four Questions

A feasibility review in progress, testing a product against desirability, feasibility, viability and operability
A feasibility review in progress — no single lens can compensate indefinitely for the absence of another.

An engineer may confirm that a chair can be fabricated from a specific steel section. A software architect may demonstrate that a platform can process the expected transactions. Neither answer establishes whether customers want the product, whether the organization can produce it consistently, or whether its economics will remain sustainable after launch.

The familiar design-thinking model evaluates innovation through desirability, feasibility and viability. Desirability asks whether the solution matters to people. Feasibility examines whether it can be produced with the available technology and capabilities. Viability considers whether it can survive economically.

For products intended to live beyond their first release, a fourth lens is necessary: operability. Operability asks whether the product can be supplied, monitored, repaired, supported and eventually retired without destroying the value it was designed to create.

These questions are connected. A desirable product may be impossible to manufacture at the expected price. A technically feasible platform may require operating costs greater than the revenue it generates. A profitable first release may accumulate maintenance obligations that make each later improvement slower and more expensive.

Feasibility is therefore not a gate crossed once. It is a condition examined again as the product, its market and its production system change.

The four lenses of product feasibility

DESIRABILITYDo people need it?FEASIBILITYCan we make it?VIABILITYCan it sustain a margin?OPERABILITYCan we keep it working?PRODUCT DECISION

From Direction to an Investment Decision

Sorting product ideas by expected value against delivery difficulty
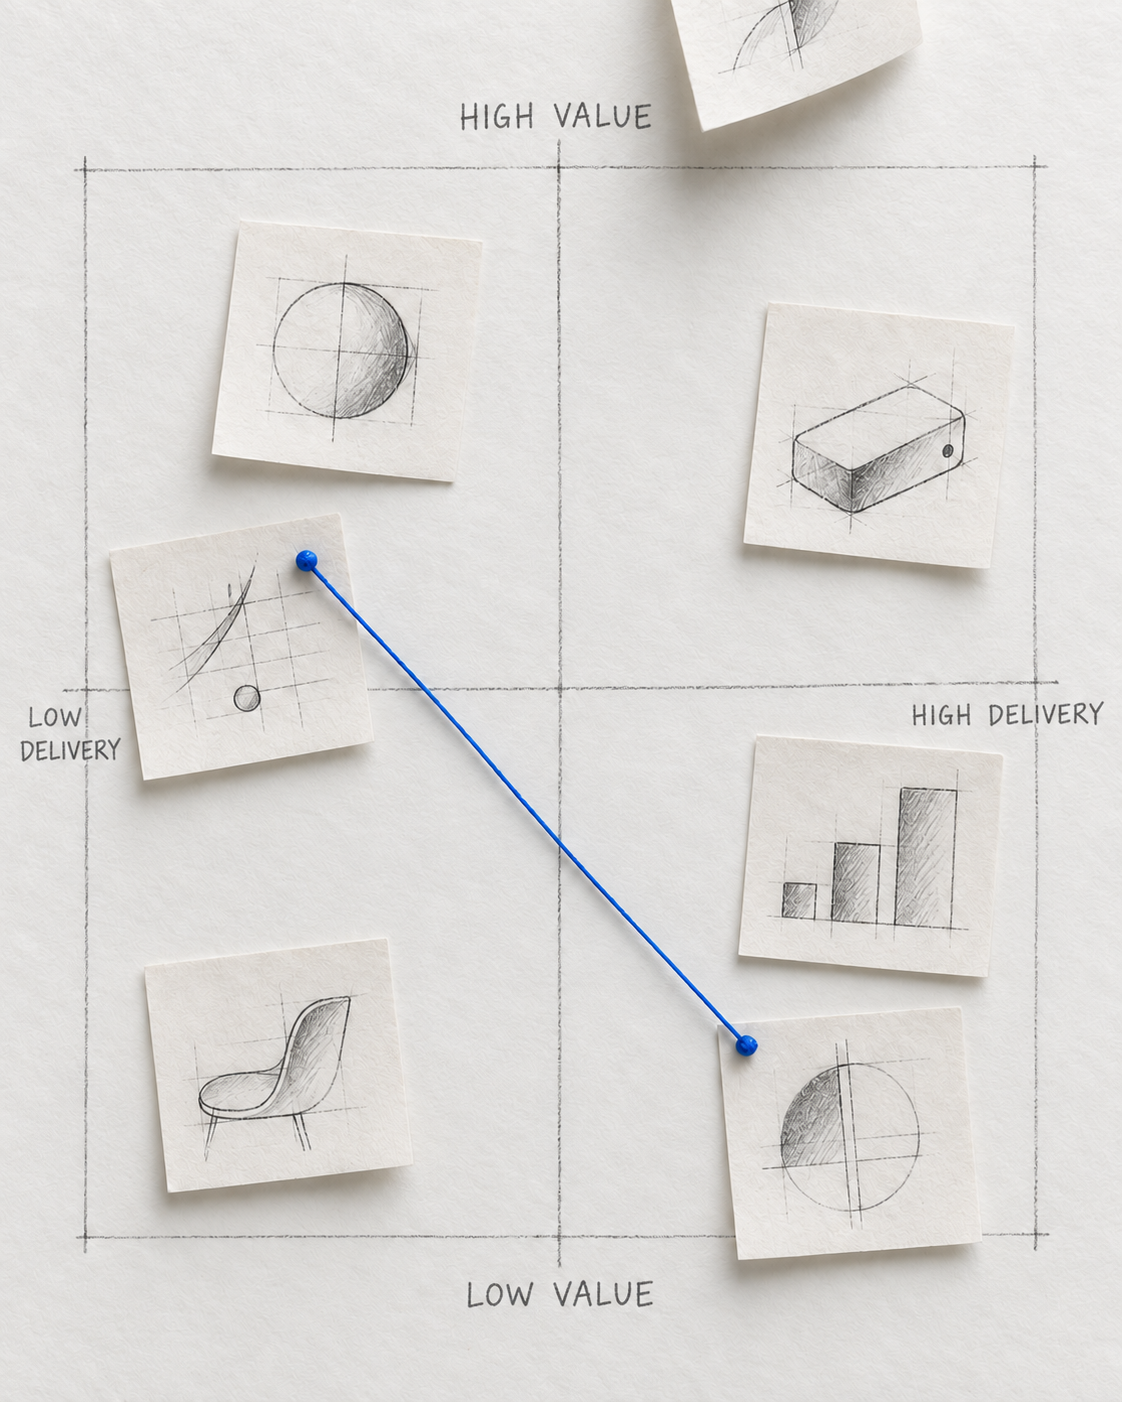
Sorting ideas by value and difficulty — a living decision instrument, not a ceremonial workshop artifact.

Before calculating detailed costs, the team needs to decide which product assumptions deserve investment. A simple decision quadrant can compare expected value with total delivery difficulty.

Expected value includes customer benefit, strategic contribution and economic potential. Difficulty includes cost, time, technical uncertainty, dependencies and operational risk. The quadrant is not a mathematical proof of viability — its purpose is to expose the relationship between benefit and effort.

An idea in the upper-left combines high expected value with low difficulty and is a strong candidate for validation. An idea in the upper-right may still be valuable, but the team should divide it, investigate its largest uncertainties, or search for another way to produce the result.

The lower-right area deserves particular attention. Organizations often continue funding expensive, low-value features because work has already begun; the quadrant makes visible what sunk-cost reasoning attempts to hide.

The position of an idea changes as evidence appears. Research may raise its expected value, a prototype may reduce technical uncertainty, and a supplier quotation or a load test may reveal that the original production model is not viable. The diagram is a living decision instrument, not a ceremonial workshop artifact.

Product decision quadrant

Product Decision QuadrantLow delivery difficultyHigh delivery difficultyBuild and validateInvestigate andredesignAutomate or postponeDiscardHigh expected valueLow expected value
High-value ideas are not automatically approved; difficult ideas require stronger evidence, decomposition or a different production model.

The Anatomy of Cost

Six cost families sharing one language across physical and digital products
Six families, one shared language — development, production, operation, storage, maintenance, retirement.

Once a product hypothesis deserves further exploration, its cost must be decomposed. A first model can use six families: development, production, operation, storage, maintenance and retirement.

These categories apply to both physical and digital products. The objects inside them change, but their economic function remains surprisingly similar — a fact the table below makes explicit.

Table 2.1 — A shared cost language

Cost familyPhysical productDigital product or service
DevelopmentResearch, prototypes, engineering, toolingDiscovery, UX, architecture, development, testing
ProductionMaterials, labor, assembly, quality controlCompute, API execution, data processing, AI inference
OperationEnergy, machinery, supervision, distributionCloud services, security, observability, support
StorageRaw material, work in progress, inventoryMedia, databases, logs, backups, inactive data
MaintenanceRepairs, spare parts, tooling replacementCorrective work, upgrades, technical debt, incidents
RetirementReturns, disposal, recyclingMigration, archival, data deletion, decommissioning

This decomposition matters because early estimates frequently include development and omit the rest of the product’s life. A prototype can demonstrate that a concept works; it rarely demonstrates what it will cost to keep working for five years.

Materials Are Visible Decisions

Offcuts and yield showing the true cost of a sheet of material after waste
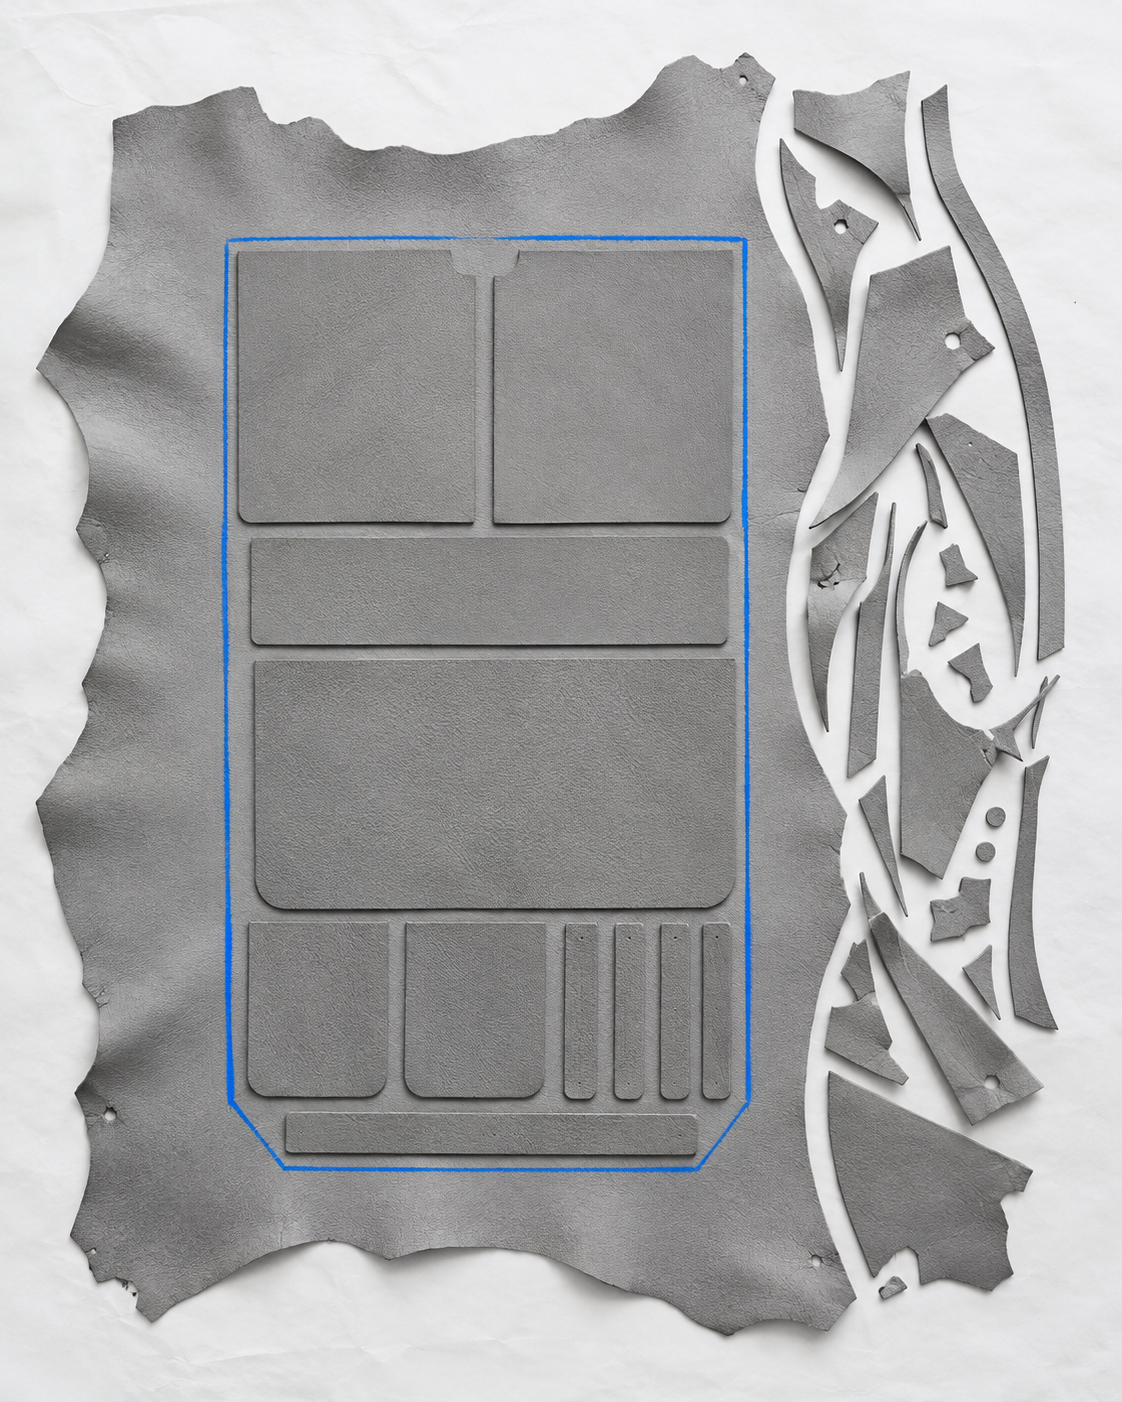
Offcuts, yield and the true cost of a sheet of material — the purchase price is only the beginning.

In a physical product, material cost appears tangible — wood, steel, leather, adhesives and finishes can be measured, weighed and quoted. Yet purchase price is only the beginning.

Material selection also affects waste, machining time, energy consumption, defect rates, packaging, transportation and maintenance. If one hundred dollars of material produces only eighty dollars of usable output after cutting and defects, the product does not have a material cost of one hundred.

Cusable material = Cpurchased material ÷ yield

At an 80% yield, one hundred dollars of purchased material becomes an effective usable-material cost of 125 dollars.

A designer can change this relationship before purchasing negotiations begin. Reducing the number of parts, changing a cutting pattern, standardizing a section, or designing several components from the same stock may save more than a small supplier discount.

Digital products consume materials too, although they do not remain visible in the final interface. Computing capacity, network transfer, storage, licensed data, third-party APIs and model tokens are transformed into a service — the material simply arrives through a meter rather than a truck.

Tolerance Is an Economic Variable

A tolerance stack drawn to scale, showing accumulated variation across parts
A tolerance stack, drawn to scale — precision creates value in some places and merely cost in others.

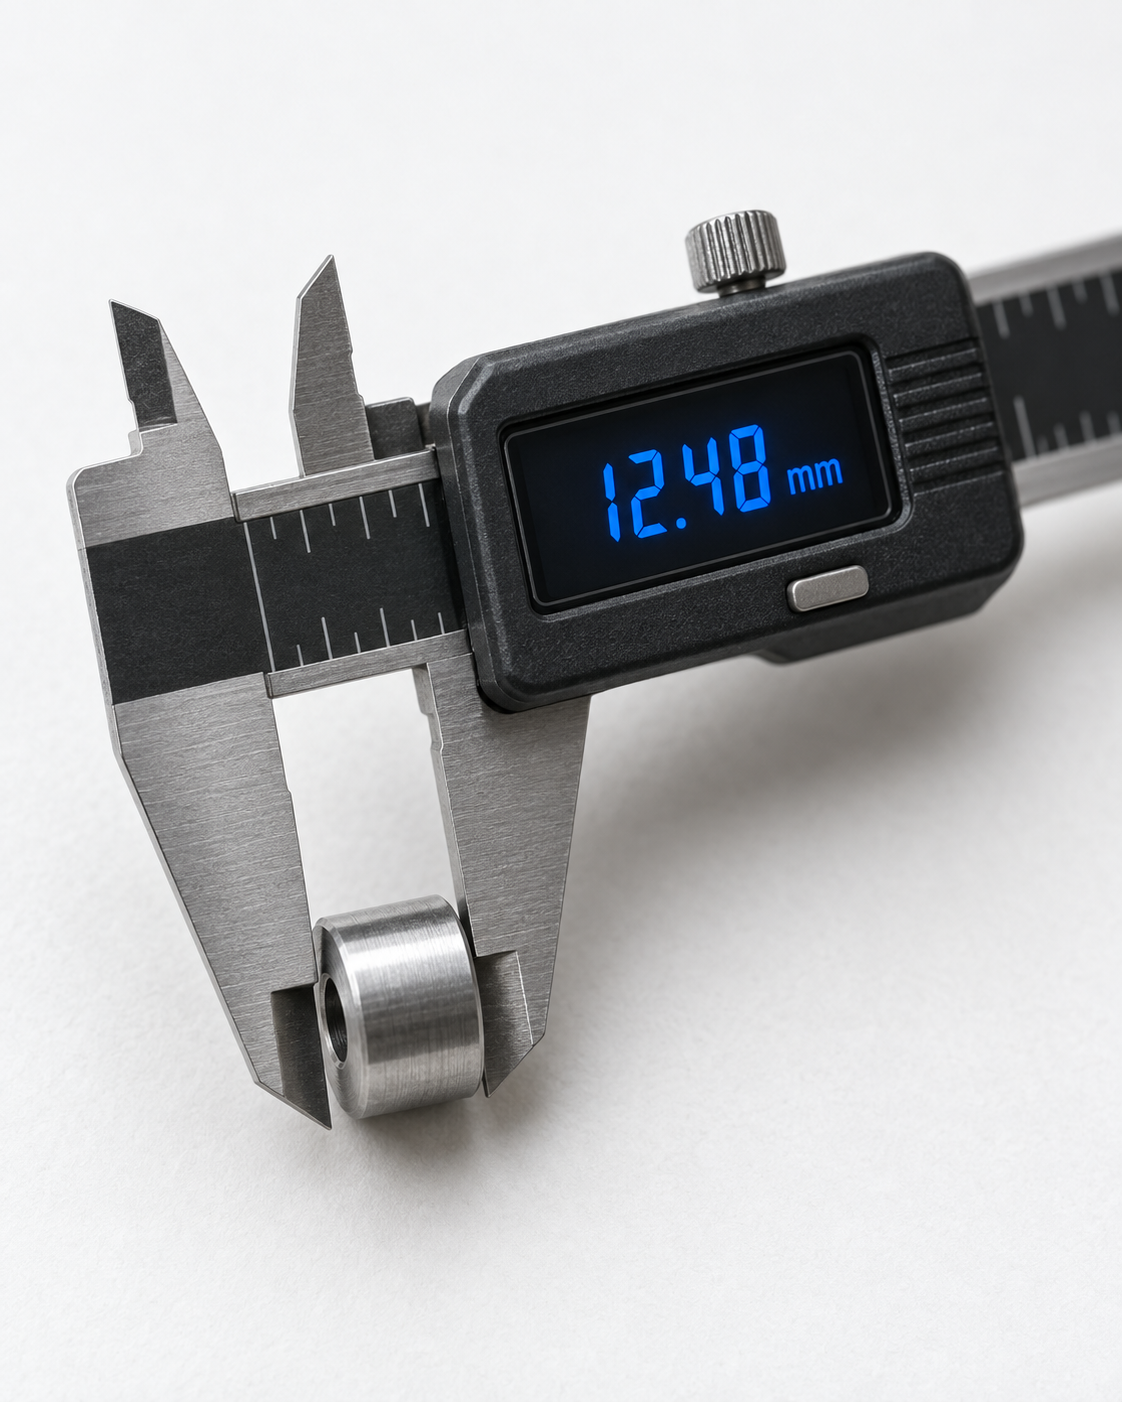
A tolerance defines how much variation the product can accept and still perform its intended function. In manufacturing it may describe a dimension, an angle, surface roughness, color variation or material strength.

Tighter tolerances normally require more precise equipment, additional inspection, better process control and higher rejection costs. Digital products have tolerances too — maximum response time, acceptable error rate, service availability, recovery time after failure, data freshness, synchronization delay and result accuracy.

A requirement for 99.99% availability is not simply a decimal placed in a document. It can imply redundancy, monitoring, automated recovery, more complex deployments and permanent operational capacity.

A tolerance should come from the consequence experienced by the user. A financial transaction and a film recommendation do not require the same certainty; a medical component and a decorative cover should not carry the same dimensional control.

Applying the strictest tolerance to every part produces an expensive product. Applying no discipline produces an unreliable one. Design consists partly in knowing where precision creates value and where it merely creates cost.

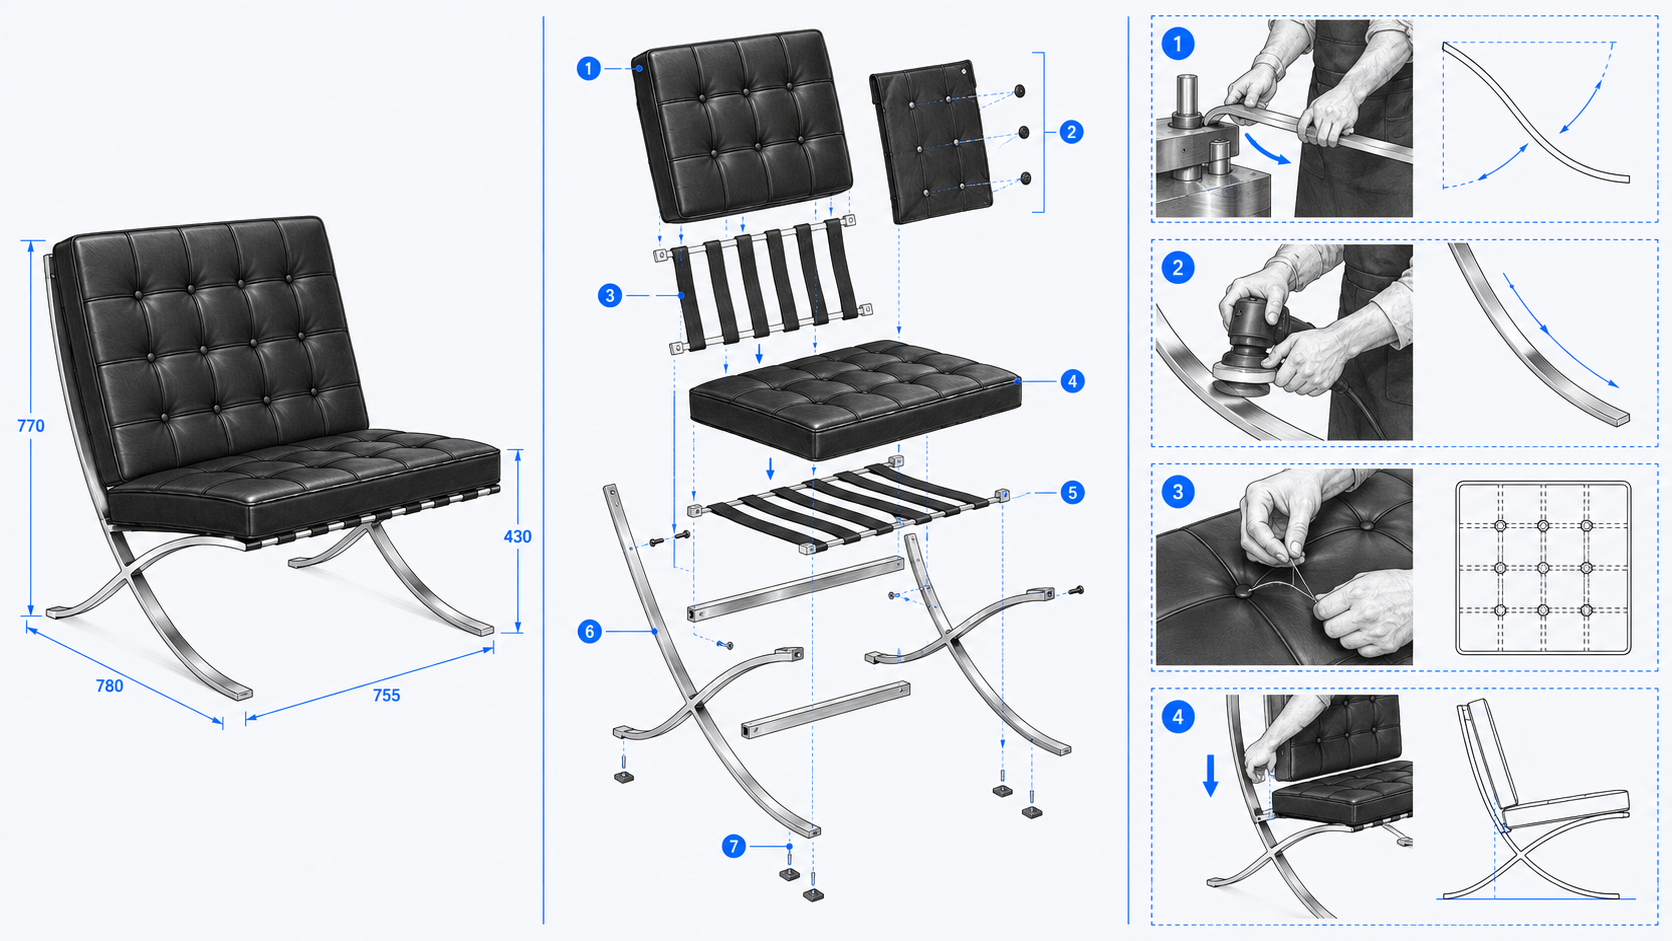
The Barcelona Chair's crossed steel frame during production, a study in form versus manufacturing method
The Barcelona Chair: apparent industrial simplicity did not create a low-cost method of production.

“Cost optimization does not always mean making the cheapest possible product.” — On the Barcelona Chair

The Barcelona Chair is often treated as a symbol of industrial modernity — its crossed steel frame appears reduced, rational and ready for reproduction. Its production tells a more complicated story.

Ludwig Mies van der Rohe and Lilly Reich designed the chair for the German Pavilion at the 1929 Barcelona International Exposition, for a representative setting where the Spanish royal couple would be received: an important, monumental chair, not inexpensive seating for a mass market.

The chair combines a curved metal frame, supporting straps and carefully upholstered leather cushions, assembled from multiple individually treated sections rather than a single mechanically formed surface.

The chair could not compete with ordinary seating through low price or high-volume efficiency. Its viability required a different equation — one the framework below makes explicit.

Place the same chair in a low-cost, high-volume strategy and the product becomes economically incoherent without changing a single line of its form.

Premium Viability, Decomposed

Rather than removing every expensive operation, the Barcelona Chair’s business model preserved them and found a market willing to pay for the result.

  1. 1

    Craft Value

    Labor the market chooses to pay for.

  2. 2

    Authorship

    A recognizable design signature.

  3. 3

    Durability

    Built to outlast a trend cycle.

  4. 4

    Cultural Meaning

    An object people choose to keep.

Form versus production

COMPLETE CHAIRBlack leather, polished steelEXPLODED FRAME,STRAPS & UPHOLSTERYMANUAL FORMING,POLISHING, SEWING& ASSEMBLY
Barcelona Chair: form versus production. Apparent industrial simplicity did not create a low-cost method of production.

Labor and the Illusion of Linear Output

A software team working together, coordination costs that do not scale linearly with headcount
A team, not a headcount — hours worked are an input, not finished pieces.

Manufacturing labor can often be connected to observable operations — cutting, bending, welding, sewing, assembling, inspecting. Even there the relationship is not perfectly linear: setup time, batch size, learning, defects and model changes affect the cost per piece.

In digital products the connection between labor and completed units becomes even less direct. Ten developers working for a month do not necessarily produce twice as much valuable software as five — adding people also adds onboarding, communication, integration, review and coordination.

A feature that appears small on the interface may require changes to identity management, data models, cybersecurity controls and several existing integrations. Another may be assembled rapidly from capabilities the organization already owns. Hours worked are an input, not finished pieces.

Software-cost estimation therefore considers functionality, complexity, criticality, technical conditions and risk — not headcount alone. This is one place where an experienced Product Manager creates measurable value: not certainty, but recognition of what a first calculation omits.

Legacy constraints behind the interface, unavailable or poor-quality data, external approvals, security and regulatory work, operational readiness, adoption, migration and the cost of failure — the Product Manager connects technical uncertainty with customer value and economic consequence.

100KACTIVE HOUSEHOLDS
IN THE MODEL
$0.33COST PER
SUCCESSFUL HOUR
$140KESTIMATED MONTHLY
CONTRIBUTION

A Streaming Service and the Cost of One Successful Hour

Northline, a fictional regional streaming product, tested against a real cost structure
Northline, a fictional regional streaming product — a vision and a strategy still have to survive contact with a cost structure.

Return to Northline, introduced earlier as a strategy bet on regional relevance over global reach. A vision and a strategy are not yet a business — they still have to survive contact with a cost structure, starting with the metric that will measure whether the bet is working.

Its North Star Metric is not the number of registrations or downloads — neither guarantees customers receive value. A more useful metric is weekly hours of content successfully reproduced by active households.

For Northline, “successfully reproduced” also requires a tolerance: playback must start within the expected time and continue without a failure severe enough to make the viewer abandon it. The metric therefore connects customer experience with technical and economic performance.

Illustrative monthly scenario

VariableAssumption
Active households100,000
Average successful viewing20 hours
Successfully streamed hours2,000,000
Subscription revenue per household$8.00
Monthly revenue$800,000
Fixed and step-fixed costs$420,000
Variable cost per streamed hour$0.12
Total variable cost$240,000
Estimated contribution$140,000

These numbers do not represent Netflix or a particular cloud provider — they form a transparent model for understanding cost behavior. The estimated monthly contribution is revenue minus fixed and variable costs: 800,000 minus 660,000, or 140,000 dollars. The cost per successfully streamed hour works out to $0.33.

Now imagine viewing rises to thirty hours per household without a price change. Engagement improves, but variable consumption also increases: an additional million viewing hours costs 120,000 dollars more, so the North Star Metric moves upward while the margin moves downward. This does not mean the metric is wrong — it means a North Star must be accompanied by economic guardrails.

A North Star Metric needs economic guardrails

CUSTOMER VALUESuccessful hoursPRODUCT GROWTHRetentionVARIABLE USEDelivery + computeREVENUECOSTSUSTAINABLE MARGIN
Greater engagement creates value but may also increase the cost to serve.

When Growth Changes the Product

A system architecture redesigned around real demand instead of initial assumptions
A system redesigned around real demand — architecture is part of the business model.

Northline’s first architecture might be intentionally simple — a limited catalogue stored in one cloud region, encoded into a few playback formats, delivered through external services. This may be the fastest, least expensive way to test whether the audience exists.

If the product gains traction, its economic conditions change. More users create more concurrent sessions, a larger catalogue increases storage and encoding, and expansion to new countries adds content rights, regional infrastructure, support complexity and new device profiles.

Large streaming platforms bring content closer to viewers because repeated long-distance delivery is expensive and can damage performance. The specific architecture is not universal — the principle is that as demand becomes observable, the production system can be redesigned around actual patterns rather than initial assumptions.

Northline might pre-encode its most-watched titles, place popular assets closer to concentrated audiences, change storage tiers, eliminate low-use formats, cache repeated requests, or scale variable services according to demand.

Cloud autoscaling can align capacity with consumption, but it cannot correct an inefficient unit of work. If every streamed hour uses unnecessary processing, scaling simply automates the multiplication of that cost. Architecture is therefore part of the business model.

Product growth changes the production architecture

VALIDATIONSimple hostingSmall catalogueTRACTIONMore formatsGrowing supportREFINEMENTCaching + encodingArchitecture redesignSCALECDN + regional capacityCost allocation
Refinement continues after traction — scale informs a return to refinement, not a finish line.

AI Changes the Shape of Labor

An AI-assisted workflow with retries and human review, the real cost behind faster generation
Retries, review and the real cost of speed — faster generation is not the same as proportionally cheaper production.

Artificial intelligence can reduce the time required for research, coding, content tagging, interface exploration, testing and documentation — and let a team explore more alternatives before selecting one. But faster generation is not the same as proportionally cheaper production.

CAI workflow = Cinference + Cretrieval + Cevaluation + Cretries + Chuman review + Coperation

A model with a lower price per token may produce a higher cost per successful task if its outputs require more retries or manual correction. A generated component may appear complete while still requiring security review, integration, testing and long-term ownership.

This is why AI-assisted estimates can remain far from reality — the tool may estimate the effort visible in the request while missing the environment the work must survive in.

Cloud providers recommend measuring unit costs — cost per inference, per data point, per completed task — alongside business-value measures, and continuously comparing costs and outcomes as the system and its resource allocation are refined. AI changes the speed of production. It does not remove the obligation to understand production.

Estimation Is a Range, Not a Promise

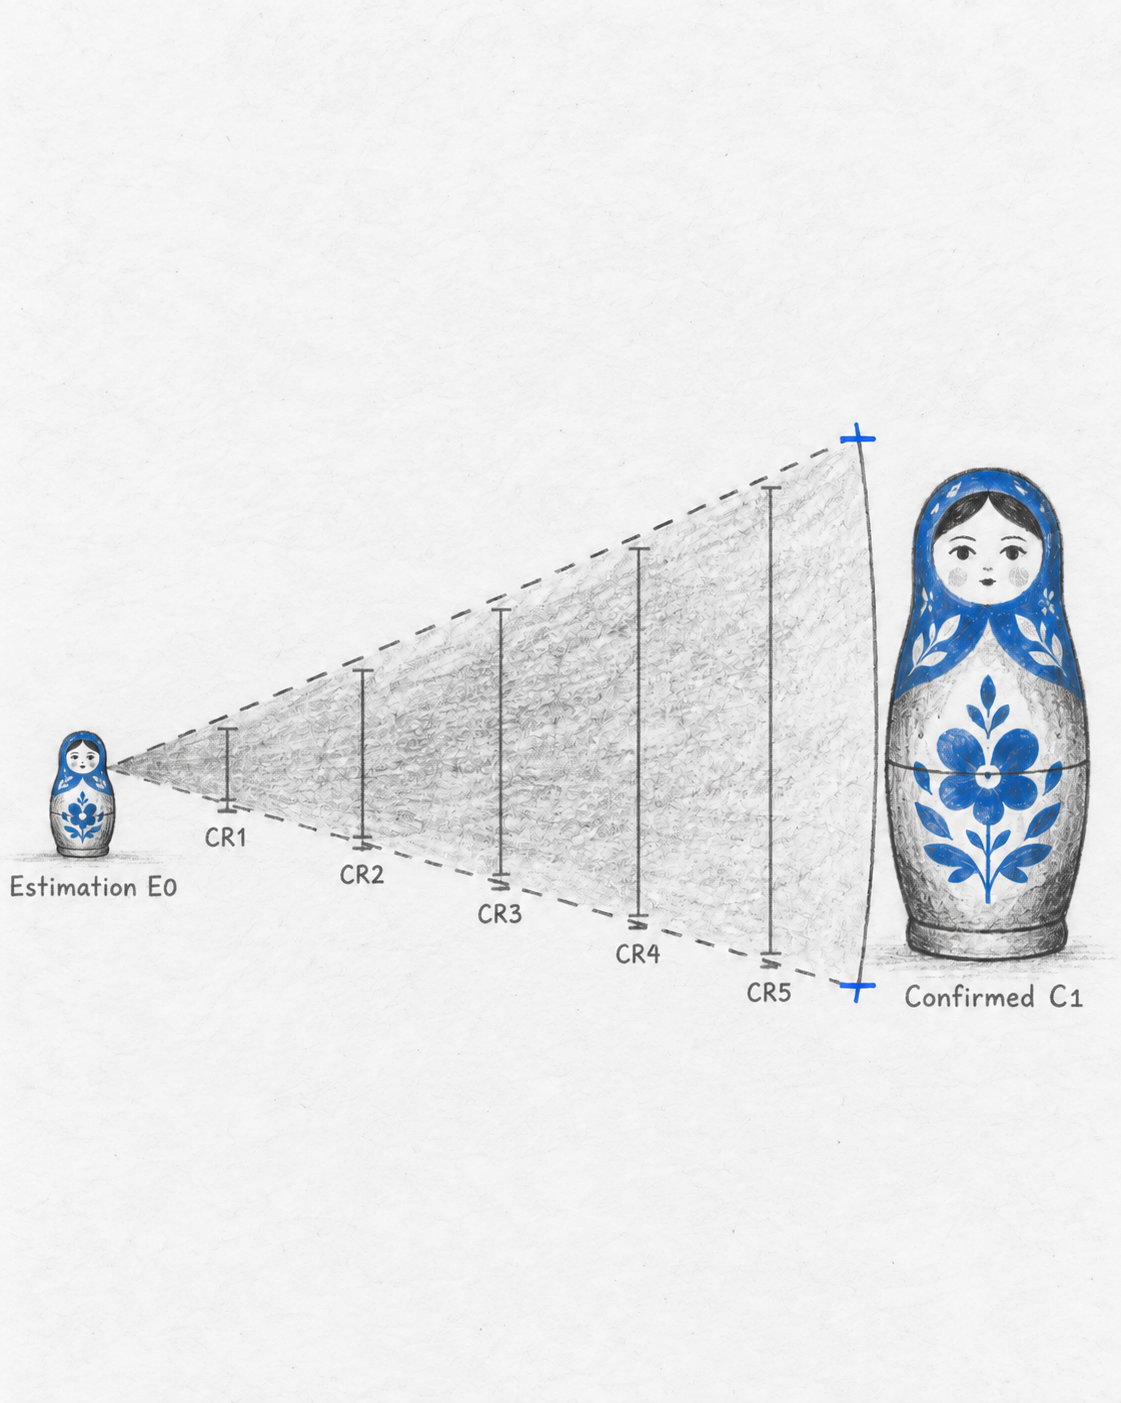
A cone of uncertainty narrowing from an early estimation to a confirmed cost, with confidence ranges marked along the way
A forecast, not a receipt — an estimate narrows as confidence ranges close in on a confirmed cost.

An early estimate will be wrong. That does not make it useless — its purpose is not to disguise uncertainty with a precise figure, but to reveal which assumptions could change the investment decision.

A credible estimate begins with a technical baseline, decomposes the work, records assumptions and applies more than one estimating method, then tests sensitivity and risk before comparing the forecast with actual results.

Instead of saying the product will cost $500,000, a team can say: under the current catalogue, device coverage and viewing assumptions, the first release is expected to cost between $450,000 and $650,000, with content preparation and delivery volume as the greatest uncertainty.

The second statement is less comfortable but more useful — it identifies where research, prototyping or negotiation can reduce uncertainty. Different methods can be combined as product knowledge improves.

Table 2.2 — Estimation methods evolve with product maturity

MethodBest use
Analogous estimationComparing with similar products or previous initiatives
Bottom-up estimationCosting known components and activities
Parametric estimationApplying relationships such as cost per hour, unit or transaction
Three-point estimationModeling optimistic, probable and pessimistic scenarios
Activity-based costingAssigning shared costs to the activities that consume them
Sensitivity analysisIdentifying assumptions with the largest economic effect
Rolling forecastReplacing assumptions with actual performance over time

In physical manufacturing, prototypes and pilot runs reveal actual material yield, assembly time and process defects. Digital products need the equivalent — instrumented releases that measure delivery cost and operational effort, not adoption alone. An MVP that validates demand while ignoring operation validates only half of the product.

The Cost Catalogue

[ 4:5 portrait — a shared ledger, not a private spreadsheet ]
No licensed or generated image matched this section yet — left as an honest placeholder rather than a mismatched one.

Cost visibility should not remain inside a spreadsheet owned only by finance or cloud engineering. Product decisions need a shared catalogue that connects expenditure with design choices.

Every significant cost should identify the product or capability that creates it, its owner, whether it is fixed, variable or step-fixed, the unit that causes it to grow, the evidence behind the estimate, the level of uncertainty, and the date it was last reviewed.

A cloud invoice organized only by technical service is insufficient — it can show that data transfer increased without explaining which customer behavior, feature or market produced it. Product cost management requires allocation by meaningful units: active household, completed order, successful transaction, processed document or resolved request.

FinOps practices formalize this collaboration between product, engineering and finance. The objective is not simply to reduce cloud spending but to connect technology consumption with business value and assign responsibility for both.

Dashboards for forecasting, tagging, allocation, budgets and anomaly detection can support this work, but their value depends entirely on the quality of the product model underneath them. A sophisticated dashboard cannot repair an undefined unit of value.

Design Continues After Launch

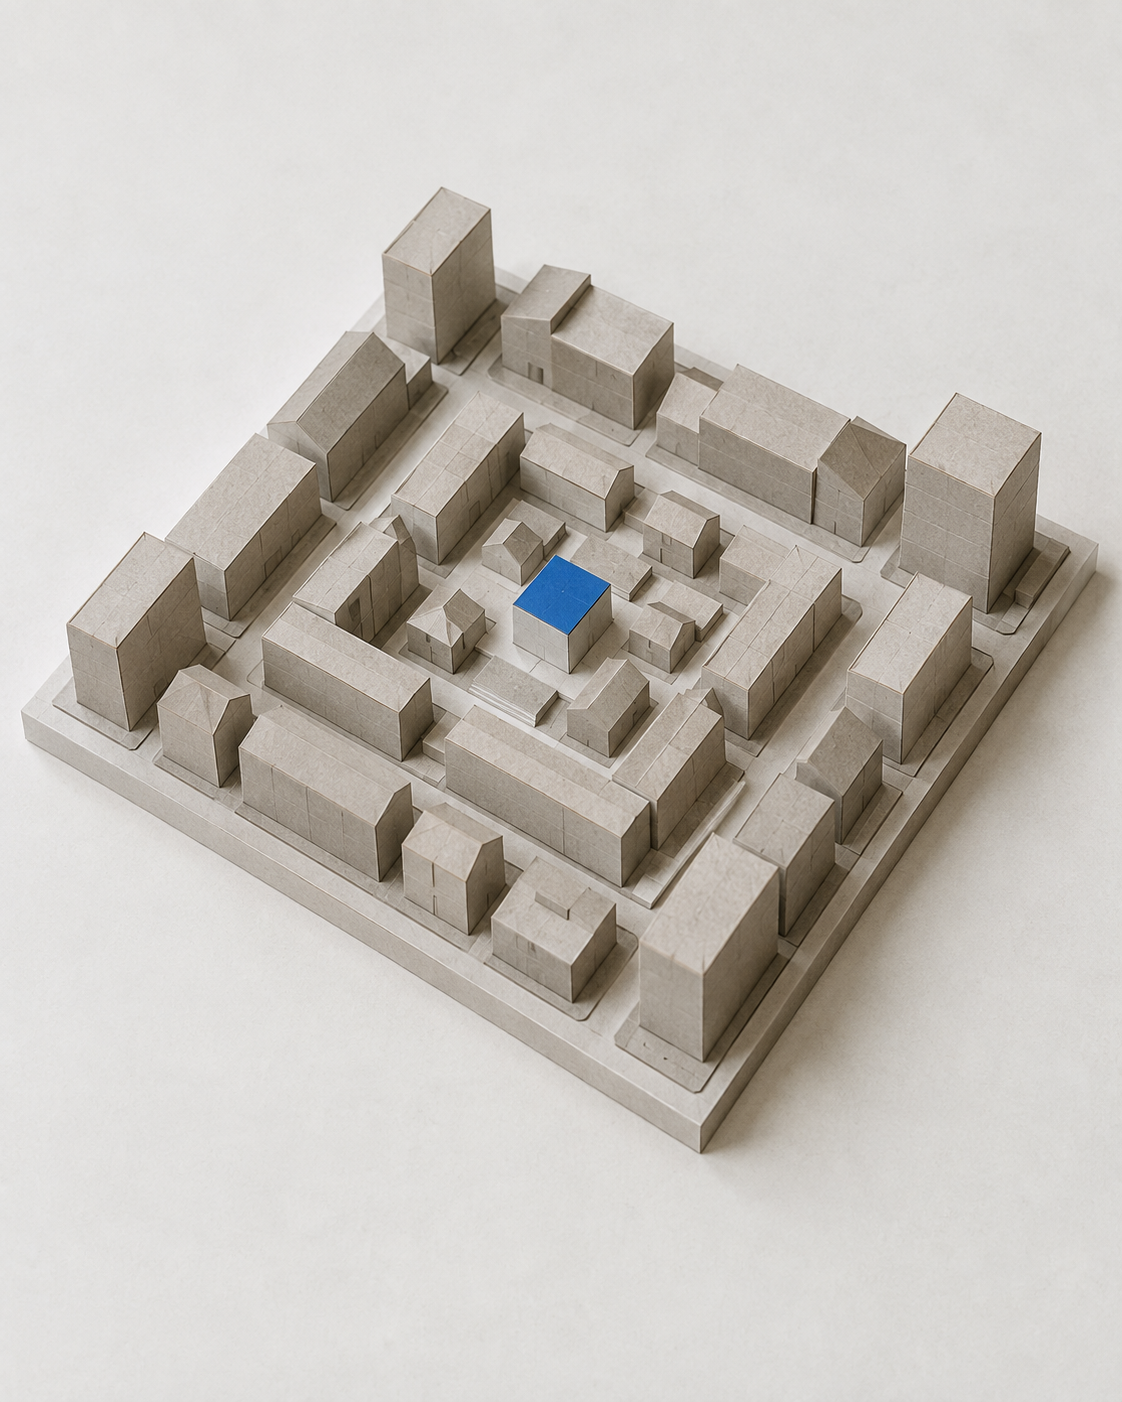
A product still being designed and refined after launch, not a finished artifact
A product, still being designed — the most resilient products are those built to change when reality arrives.

The Barcelona Chair and Northline appear to belong to different worlds — one transforms steel and leather into a physical object, the other transforms data, infrastructure and content rights into hours of entertainment. Both reveal the same relationship between design and economics.

The Barcelona Chair preserved expensive craftsmanship and found viability through a premium position. Northline cannot solve increasing consumption simply by charging more for every technical inefficiency; it must continually redesign how content is encoded, stored and delivered.

Materials change, suppliers disappear, usage patterns evolve, technology ages, regulations introduce new controls, and growth reveals bottlenecks that were invisible in the prototype. Cost refinement is not evidence that the original product failed — it is part of the product’s development.

The failure occurs when the organization protects the original design after the evidence has changed. A product is not only the object, interface or service the customer experiences; it is also the system capable of producing that experience repeatedly.

The most resilient products are not those whose teams predicted every future cost. They are those designed with enough visibility and adaptability to change when reality arrives. Every cost begins with a decision.

REFERENCES

  1. Stratechi (Joe Newsum) — On the customer value equation, the value wedge, product dimensions, sources of competitive advantage and the four-step roadmap process.
  2. IDEO — Design thinking: desirability, feasibility and viability as evaluation lenses.
  3. Museum of Modern Art — On the Barcelona Chair, designed by Ludwig Mies van der Rohe and Lilly Reich, 1929.
  4. Knoll — The Barcelona Chair in licensed production: craftsmanship and upholstery method.
  5. NASA Software Engineering Handbook — Project attributes used in software-cost estimation.
  6. Amplitude — On defining and using a North Star Metric.
  7. Netflix — Open Connect, Netflix’s content-delivery system.
  8. AWS — Auto Scaling documentation.
  9. Google Cloud — Well-Architected Framework, AI and machine-learning workload cost guidance.
  10. GAO — Cost Estimating and Assessment Guide.
  11. FinOps Foundation — FinOps practices and principles.